IntelligentOne
IntelligentOne is an AI-powered platform designed for predictive modelling in capital markets, leveraging machine learning (ML) across technical indicators, financial metrics, and sentiment analysis. It systematically processes vast volumes of historical market data, news articles, balance sheets, and income statements.
The platform performs end-to-end data engineering, constructing relevant indicators and extracting key features that feed into a robust ML modelling pipeline. Powered by AutoML.Net, IntelligentOne dynamically selects and trains the most effective models by evaluating a wide range of machine learning algorithms.
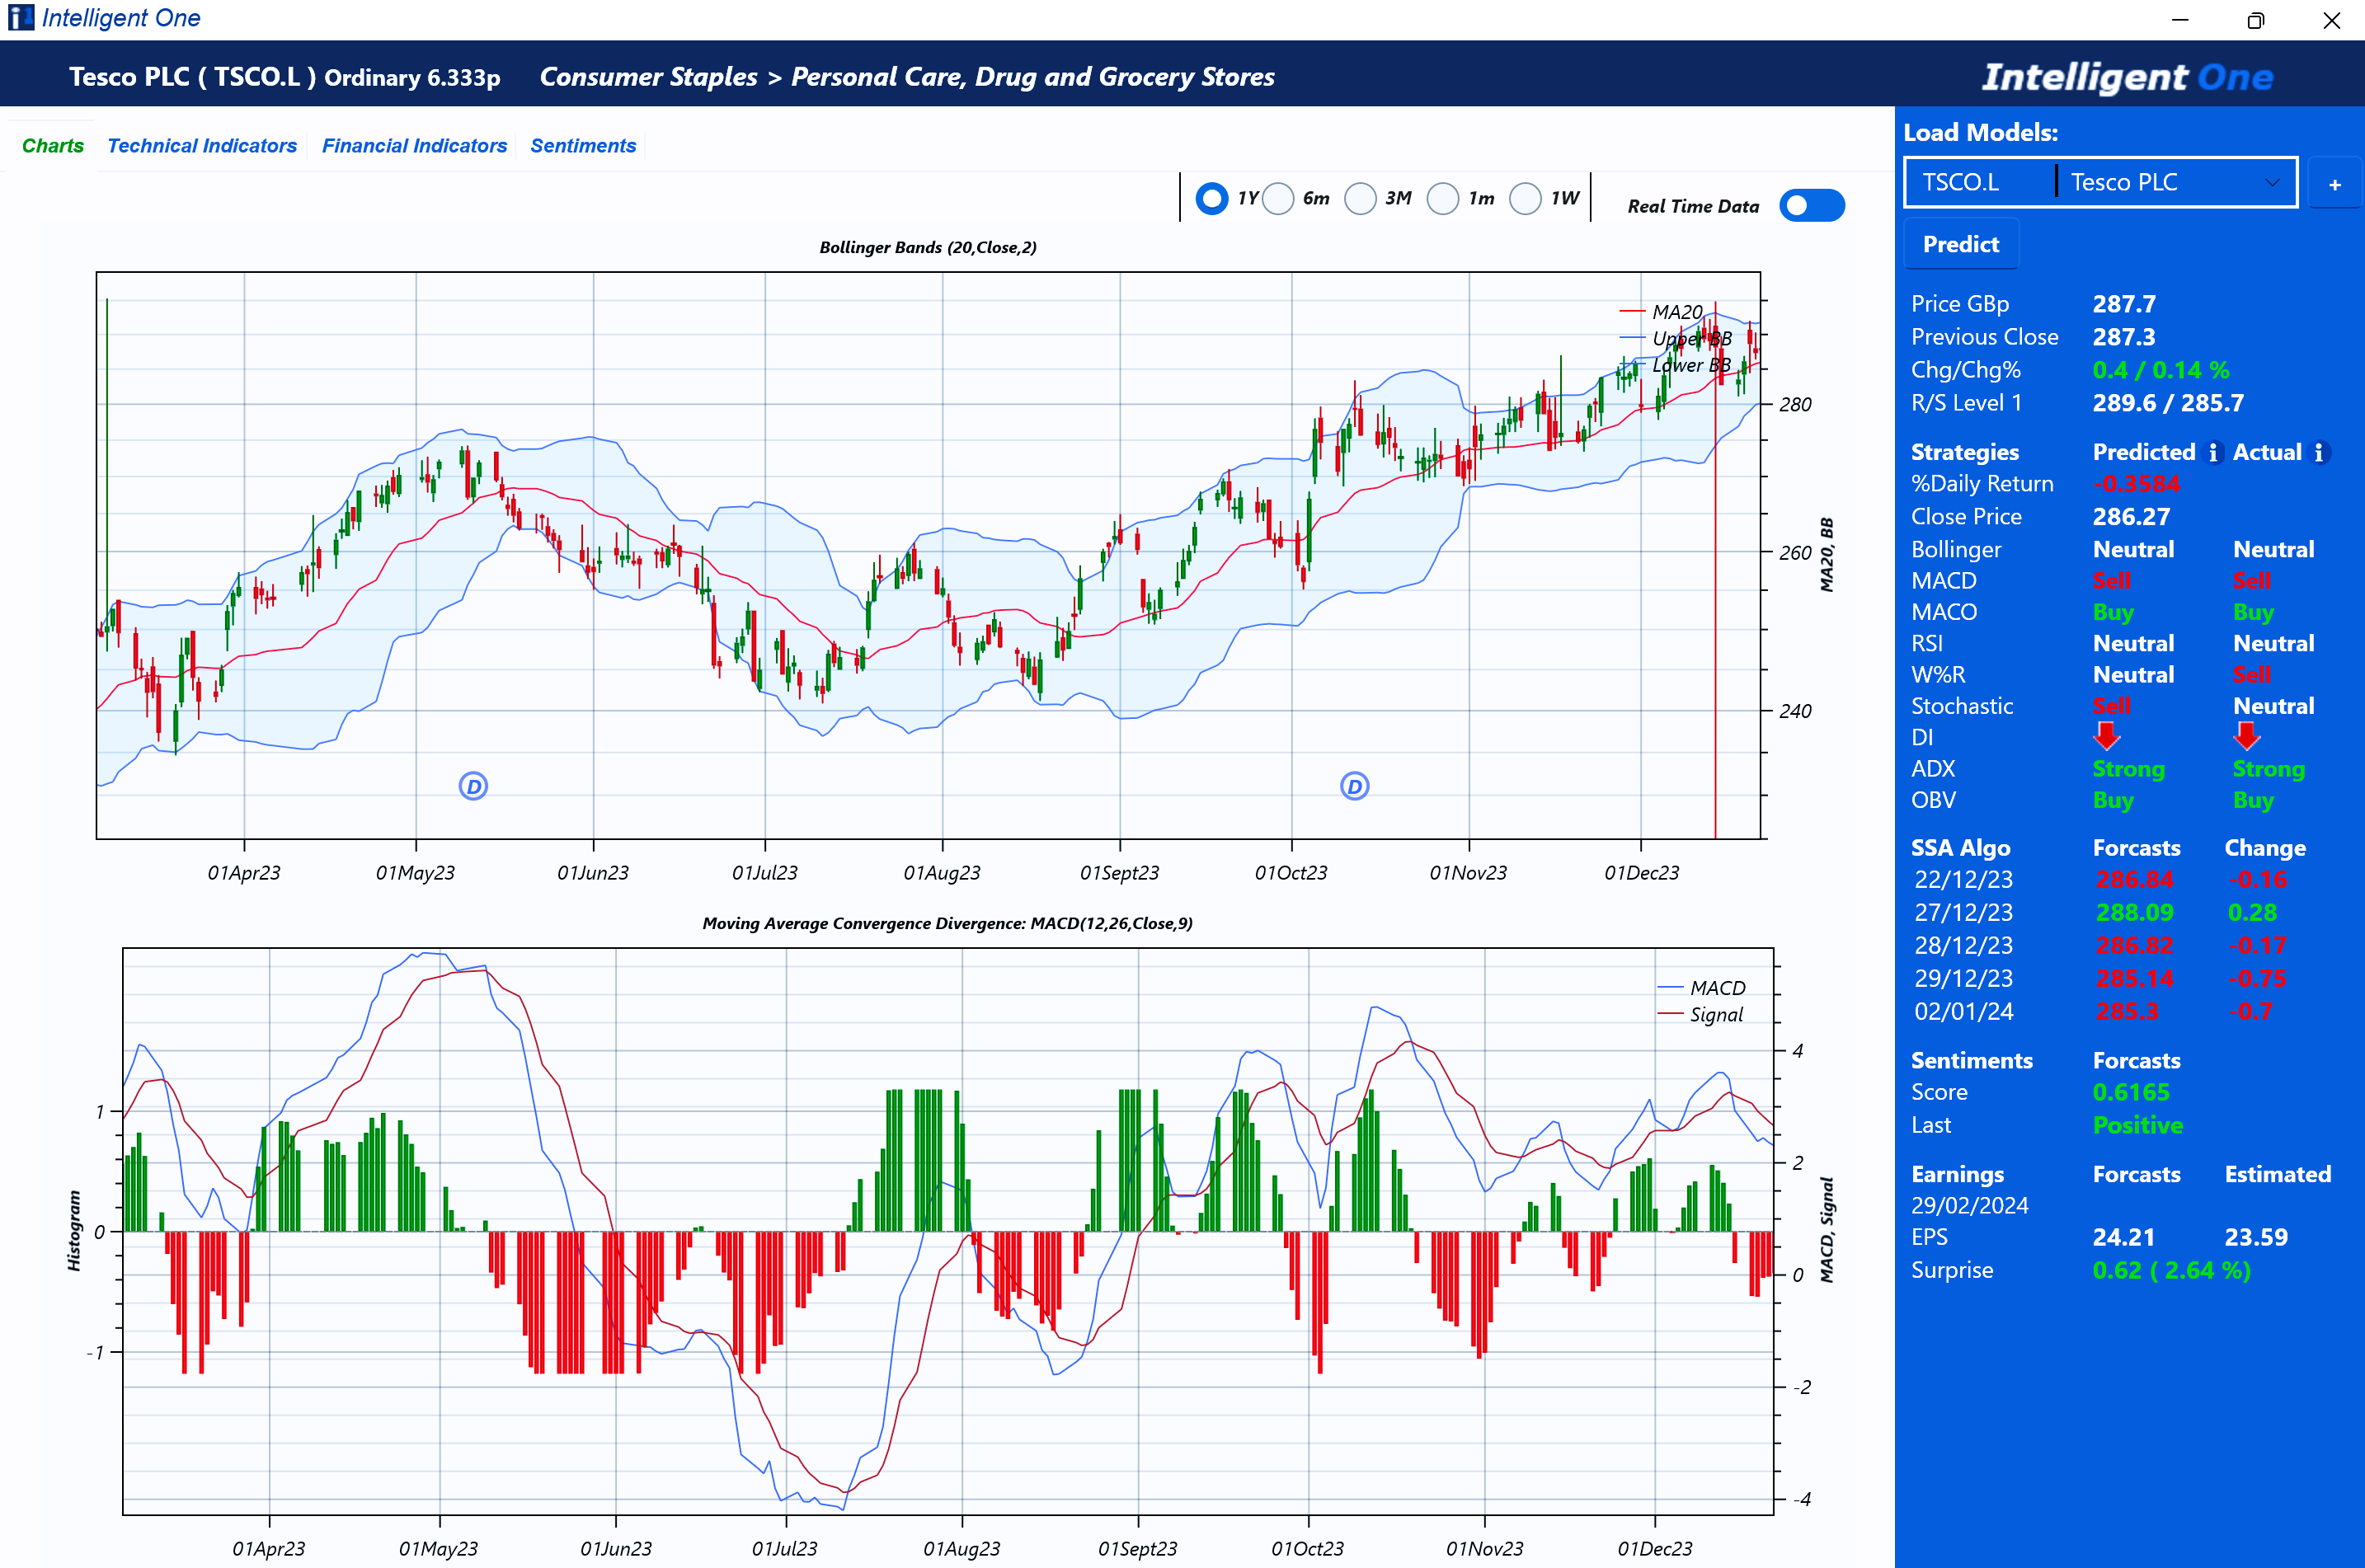
Its intuitive user interface (UI) merges real-time charting with trained model outputs, enhancing analytical depth and supporting data-driven decision-making.
We have implemented several machine learning (ML) models to address key trading strategy questions:
- Is the price action trending in a specific direction?
- Is the trend ending or reversing?
- Are there potential entry or exit points?
- What are the predicted closing prices for the next five days?
- What is the current market sentiment?
- Is there a potential earnings surprise?
The platform was verified using the following asset classes: stocks, gold, and currency pairs. For example:
Technical Indicators/Charts
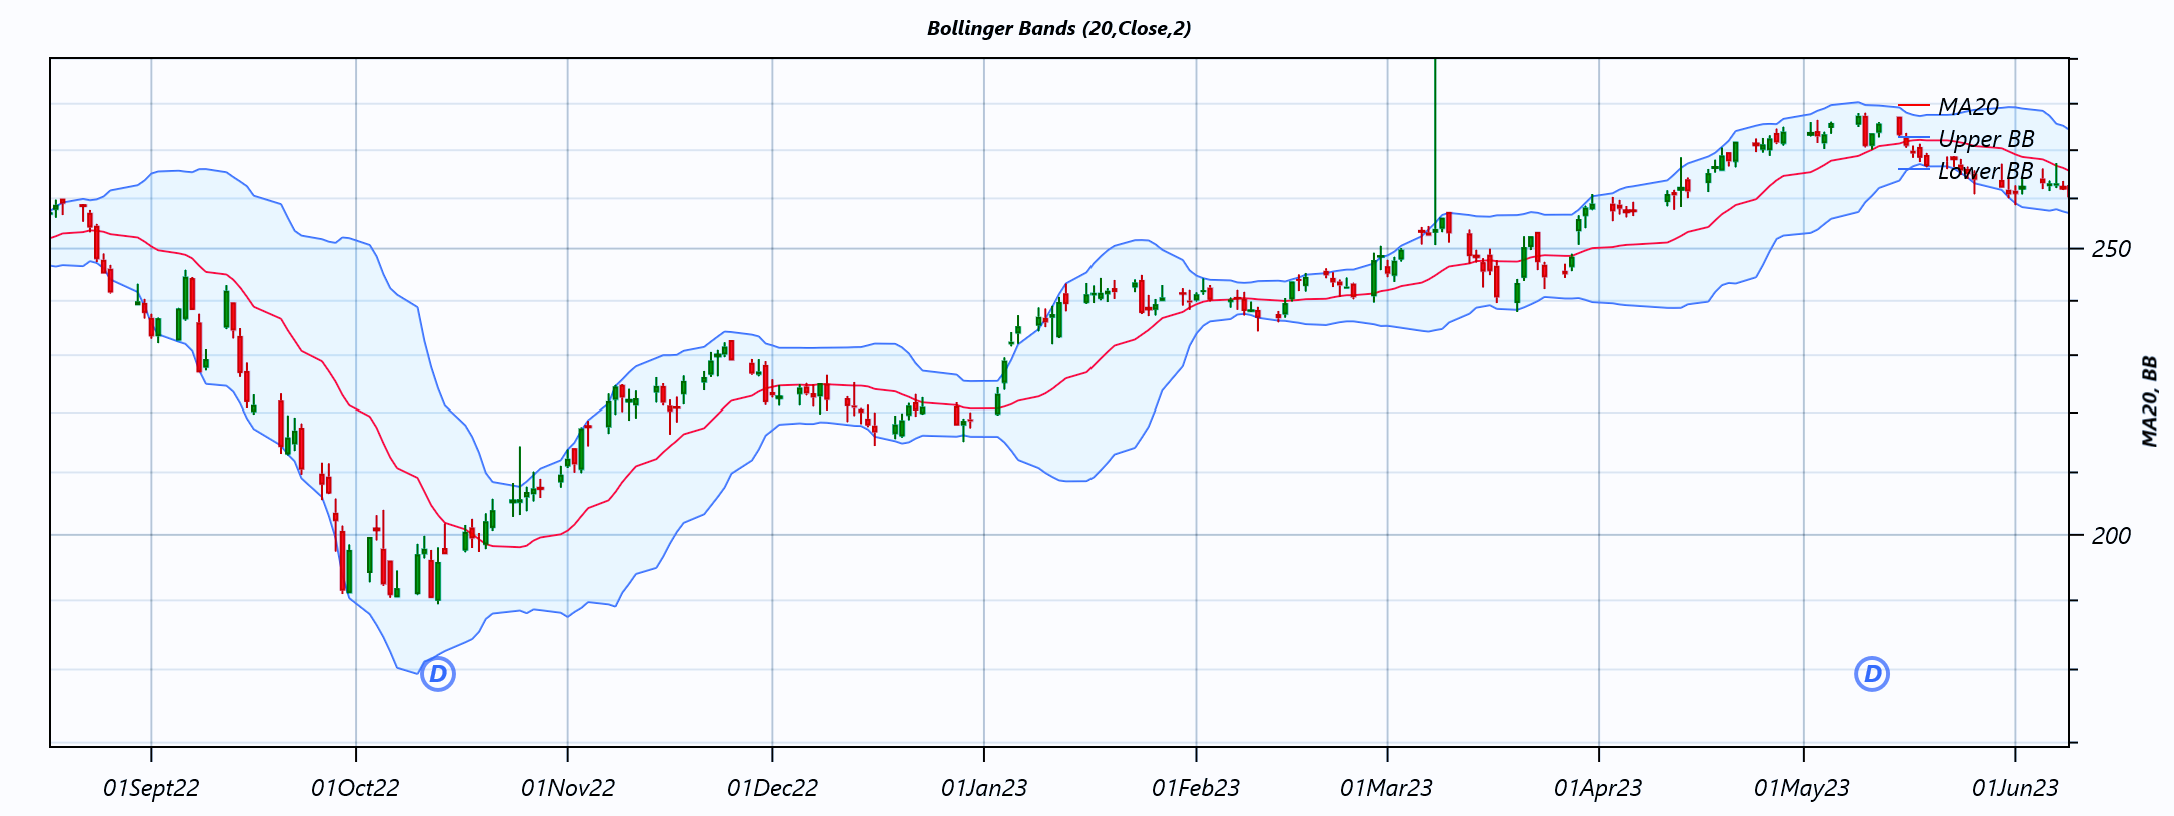
Bollinger Bands (BB)
Bollinger Bands are a technical analysis tool used to measure and visualize market volatility.
- Closing prices above the upper Bollinger Band may suggest that the stock is currently overvalued, indicating a possible price decline. In this scenario, the market is considered overbought, and a sell signal may be generated.
- Closing prices below the lower Bollinger Band may imply that the stock is undervalued, potentially signaling a price increase. Here, the market is deemed oversold, and a buy signal may be triggered.
To identify potential entry or exit points—categorized as Buy, Hold, or Sell—we employ multiclass classification modelling, which leverages machine learning to make data-driven predictions.
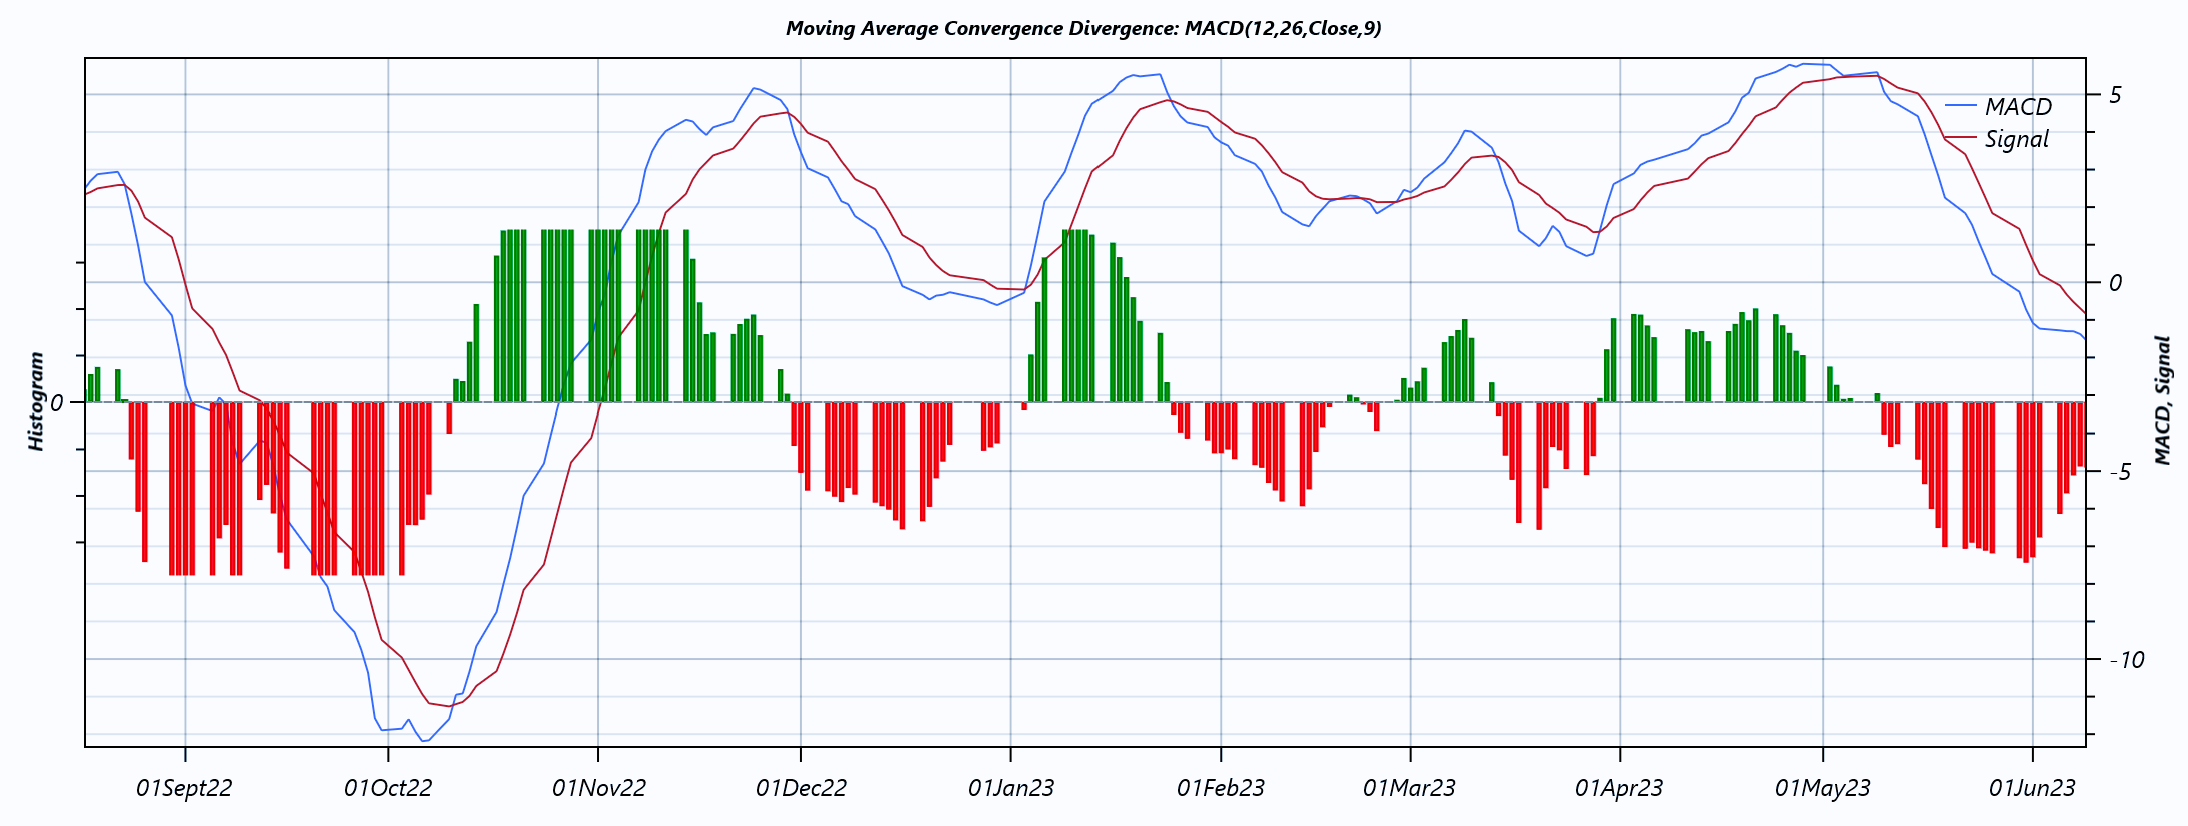
Moving Average Convergence Divergence (MACD)
Moving Average Convergence Divergence is a momentum indicator used to detect changes in the strength, direction, and duration of a trend in a stock’s price. A buy signal is generated when the MACD histogram turns positive, suggesting upward momentum. Conversely, a sell signal is triggered when the histogram moves into negative territory, indicating bearish momentum.
To predict potential trend reversals or endings, we apply binary classification modelling, which enables the identification of directional shifts based on historical data patterns and technical signals.
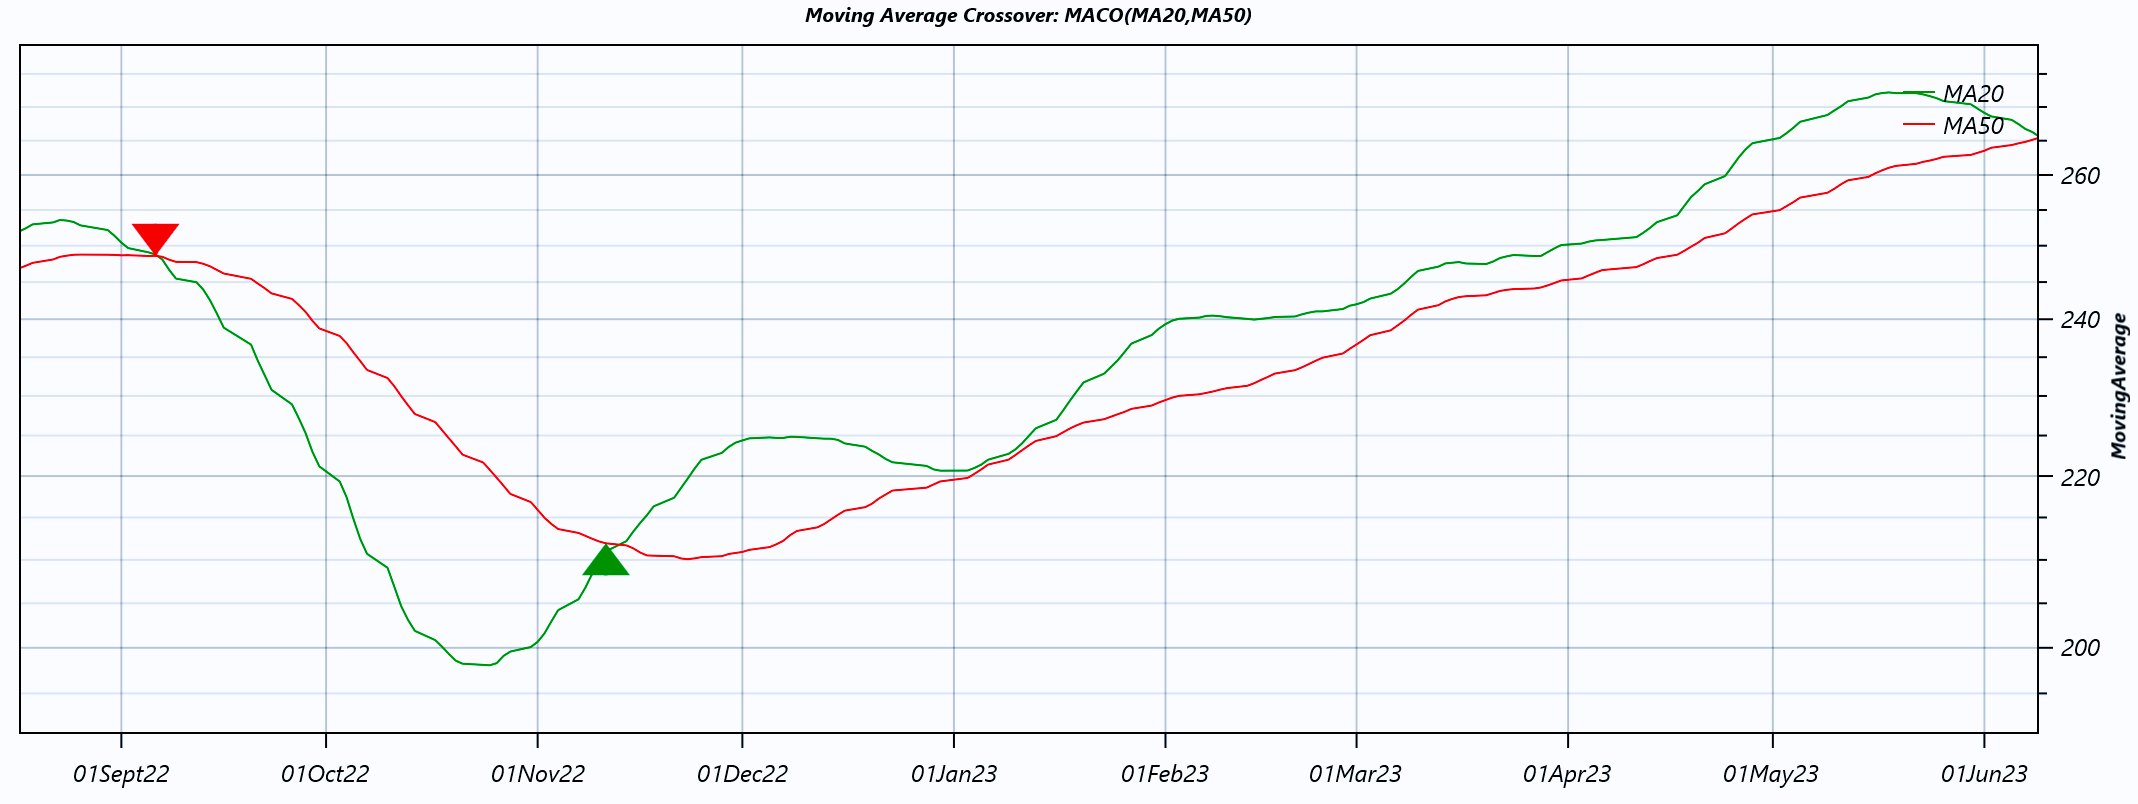
Moving Average Crossover (MACO)
We utilize two moving averages with different window sizes: the 50-day average, which reflects the long-term market trend, and the 20-day average, which captures short-term price fluctuations and responds more quickly to changes.
A potential trend shift is detected when the fast MA(20) crosses the slow MA(50):
-
A buy signal (represented by a green up-triangle) is triggered when the MA20 crosses above the MA50, indicating that the average price over the last 20 days has risen above the 50-day average—a sign of bullish momentum.
-
A sell signal (represented by a red down-triangle) is triggered when the MA20 crosses below the MA50, suggesting that recent prices have declined relative to the longer-term trend, potentially signaling bearish reversal.
We apply binary classification modelling to predict whether a trend is ending or reversing, using this crossover logic as a key input feature.
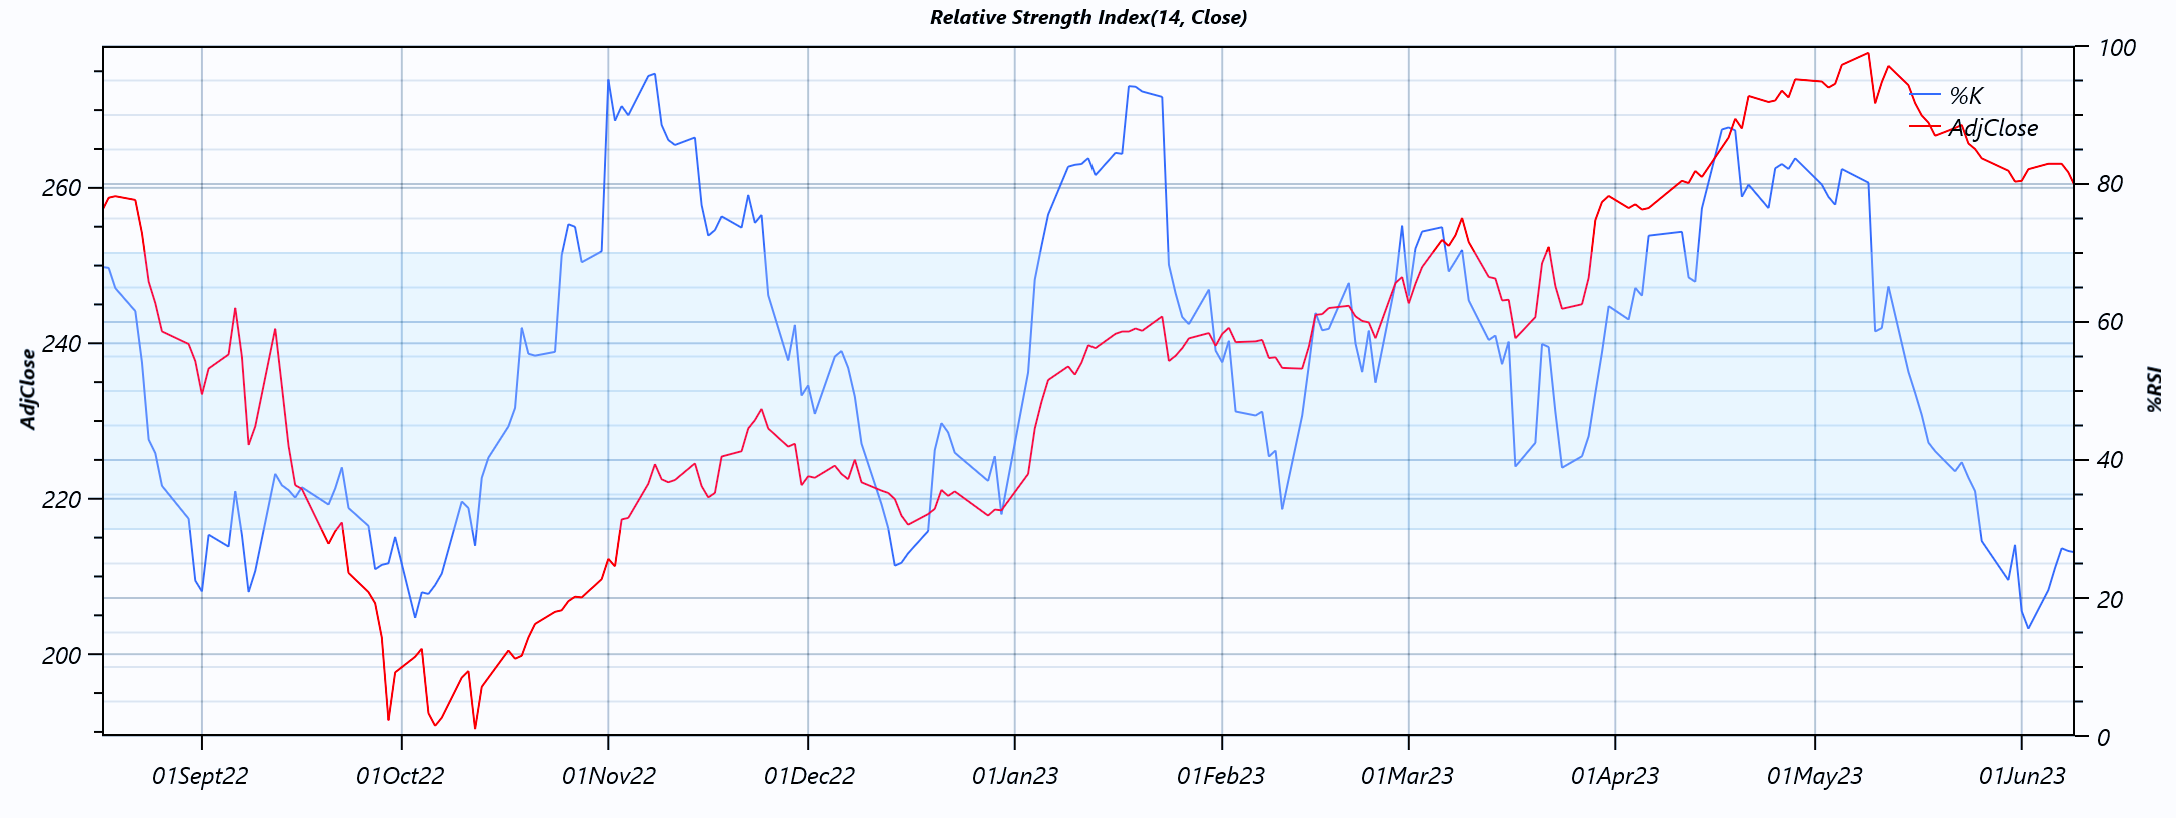
Relative Strength Index (RSI)
Relative Strength Index is a momentum indicator used to determine whether a stock is overbought or oversold.
- When the RSI falls below the lower threshold (30), it suggests the stock is oversold—a buy signal may be generated.
- When the RSI rises above the upper threshold (70), it indicates the stock is overbought—a sell signal may be appropriate.
To predict potential entry or exit points—classified as Buy, Hold, or Sell—we apply multiclass classification modelling, which enables objective decision-making based on historical RSI patterns and market dynamics.
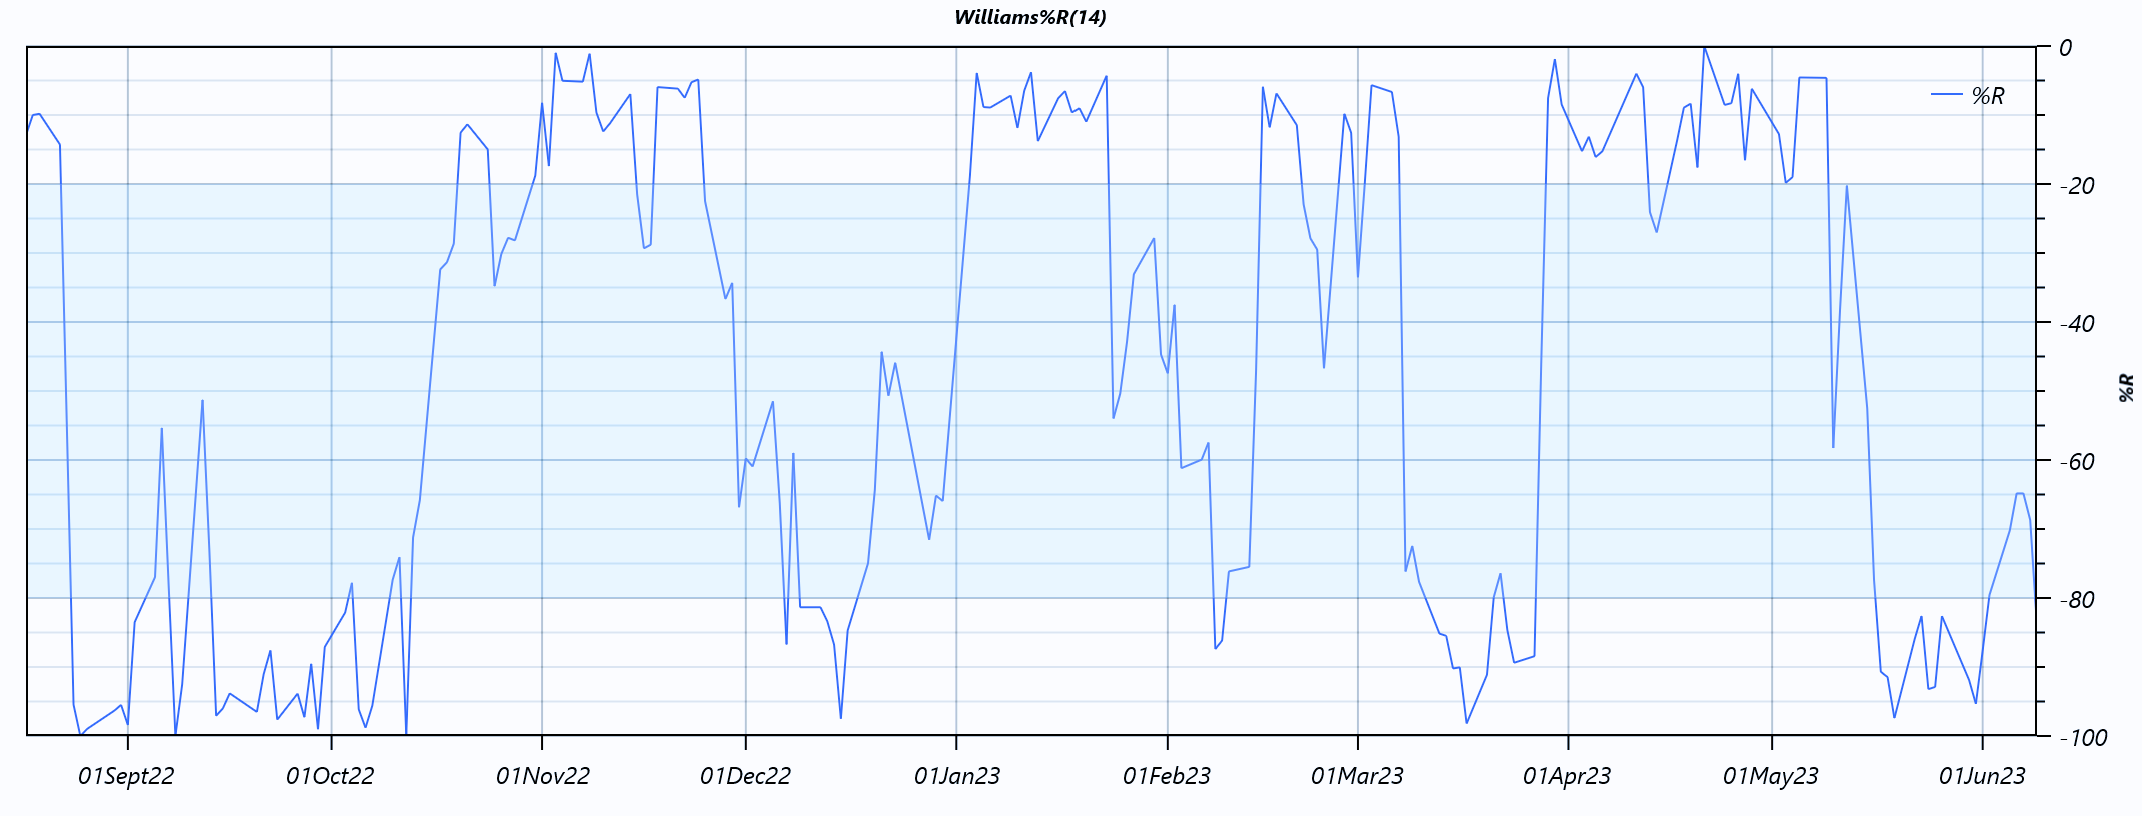
Williams %R (W%R)
Williams %R is a momentum-based technical oscillator that compares the current closing price to the high and low prices over a specified lookback period (N days). The indicator ranges from -100 to 0, with:
- Readings below -80 indicating oversold conditions.
- Readings above -20 suggesting the asset is overbought.
These threshold levels signal potential trading opportunities based on directional shifts. When the indicator crosses into or out of these zones, traders can evaluate possible entry or exit points.
To classify these opportunities as Buy, Hold, or Sell, we employ multiclass classification modelling, using historical patterns and W%R signals to train predictive algorithms.
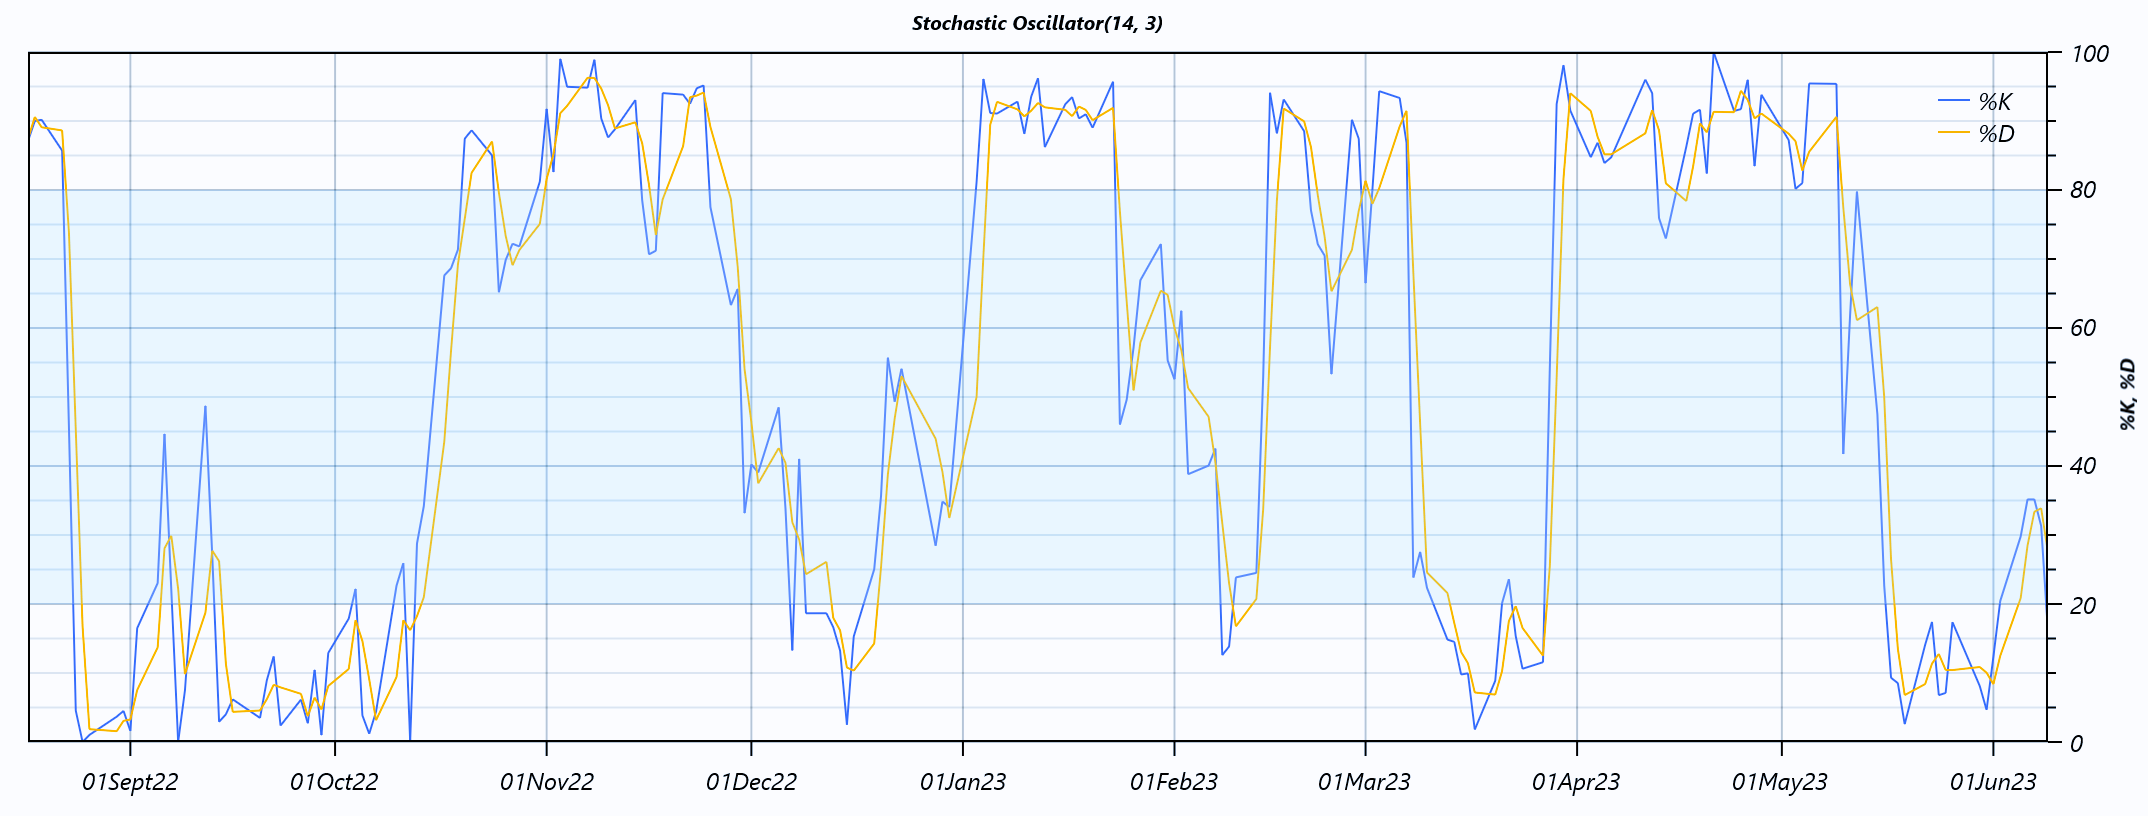
Stochastic Oscillator (SO)
Stochastic Oscillator is a momentum indicator that compares a stock’s closing price to its high-low range over a defined number of trading periods. It is based on the principle that momentum typically shifts before price does, making it a useful tool for identifying potential turning points.
The Stochastic %K and %D indicators are bounded between** 0 and 100**, functioning as classic oscillators:
-
A %D value above 80 suggests the security is overbought.
-
A %D value below 20 indicates it is oversold.
Entry and exit signals are often generated based on intersections between %K and %D:
-
A buy signal is triggered when %K crosses above %D and the oscillator value is below 20, indicating a potential bullish reversal from oversold conditions.
-
A sell signal is triggered when %K crosses below %D and the oscillator value is above 80, pointing to a potential bearish reversal from overbought conditions.
To classify these potential actions into Buy, Hold, or Sell, we utilize multiclass classification modelling, which learns from historical indicator behaviors to support predictive decision-making.
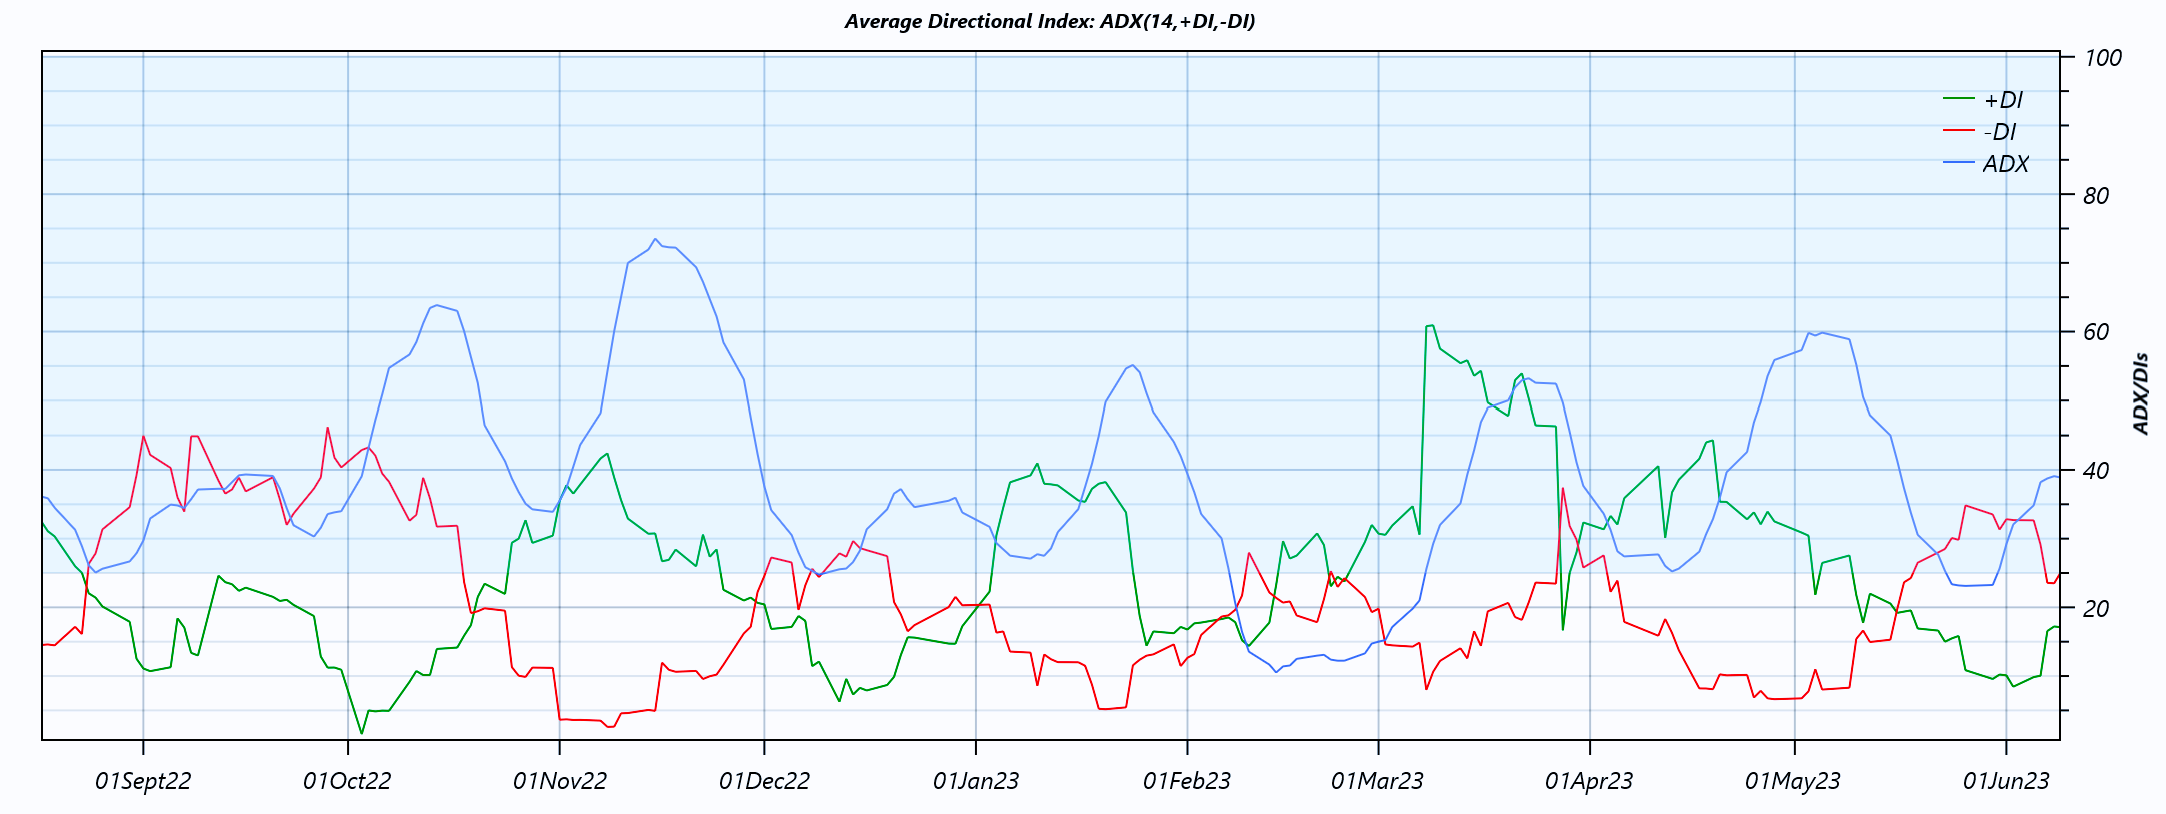
Average Directional Index (ADX)
Average Directional Index is a technical indicator used to measure the strength of a trend in the price series of a financial instrument. It is often evaluated alongside the +DI (Positive Directional Indicator) and –DI (Negative Directional Indicator) to assess both trend strength and trend direction.
-
When +DI is above –DI, the trend is considered to be bullish (an uptrend).
-
When +DI is below –DI, the trend is considered to be bearish (a downtrend).
-
Trend strength is interpreted as follows: IF (ADX > 25), then “Buy”; else “Sell”—indicating sufficient momentum for trend-based decision-making.
To predict whether a trend is present and its directional bias, we utilize binary classification modelling, which identifies elevated market conditions and infers trend reversals or continuations based on historical ADX and DI patterns.
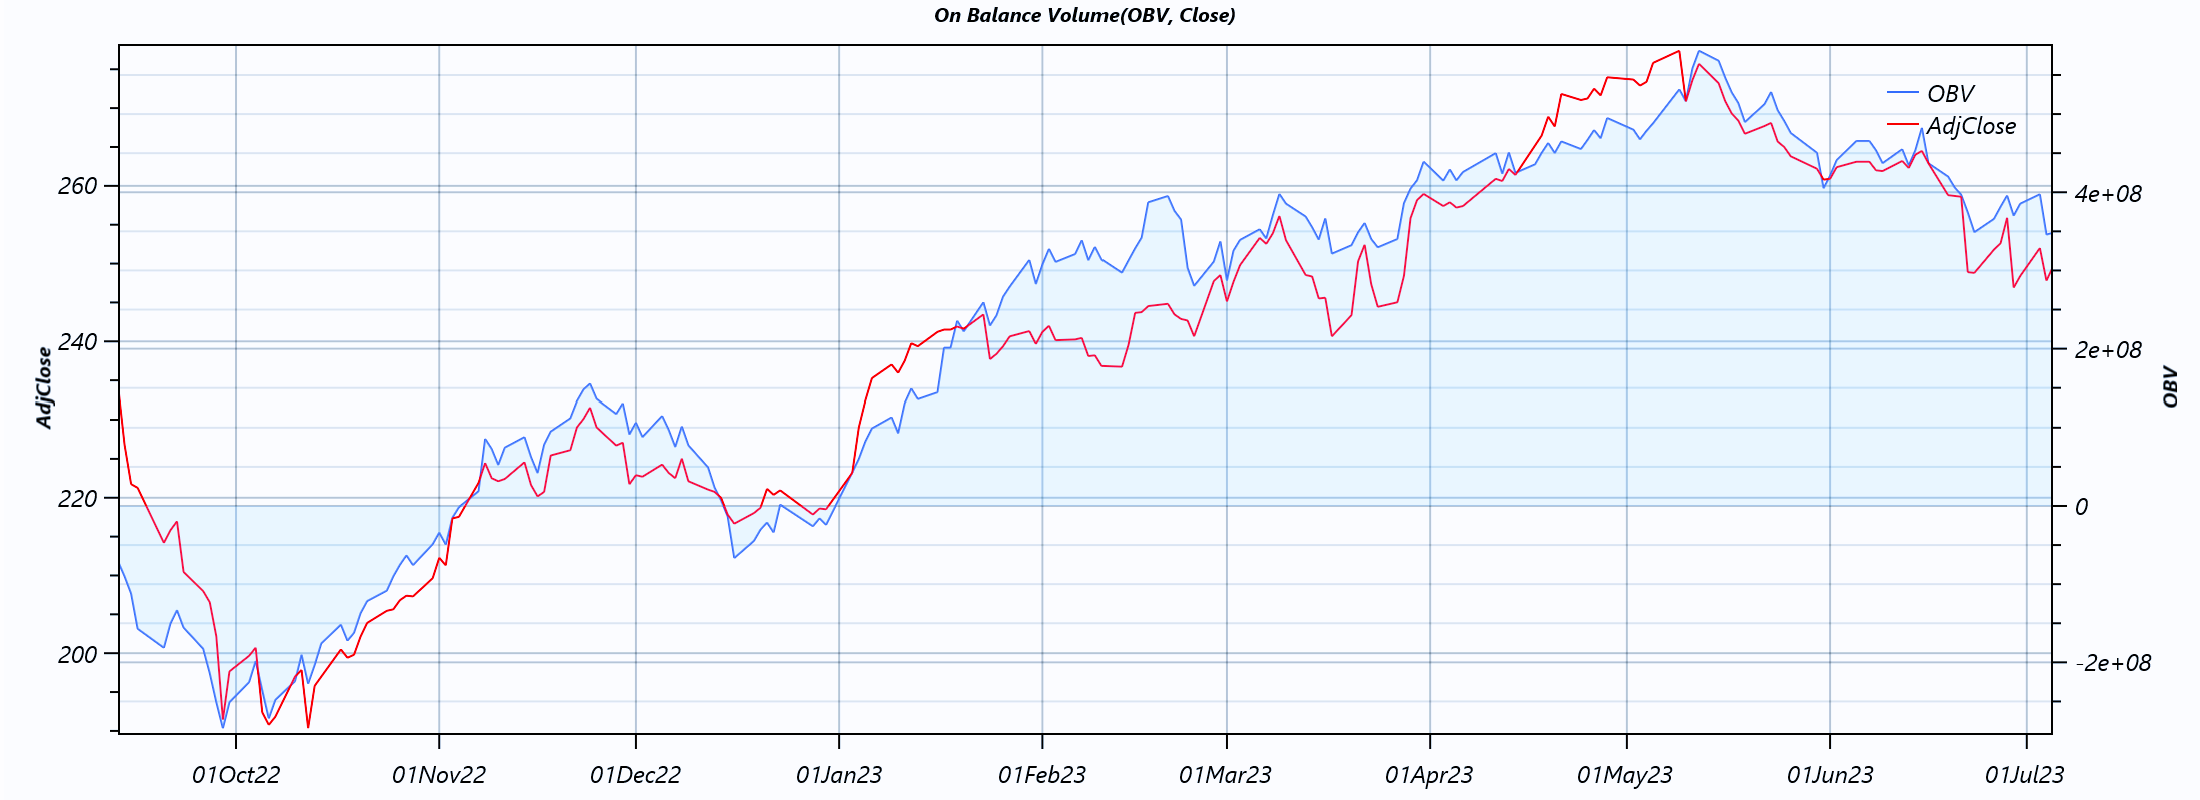
On Balance Volume (OBV)
On-Balance Volume is a technical analysis indicator that relates price movements to trading volume, aiming to identify momentum shifts in the market. By tracking volume flow, OBV can signal whether buying or selling pressure is dominating.
In our approach, the algorithm analyzes OBV trends to predict the direction of the next day’s closing stock price—whether it’s likely to increase or decrease.
To determine actionable trading signals—Buy, Hold, or Sell—we apply multiclass classification modelling, leveraging historical price-volume relationships to support informed decision-making.
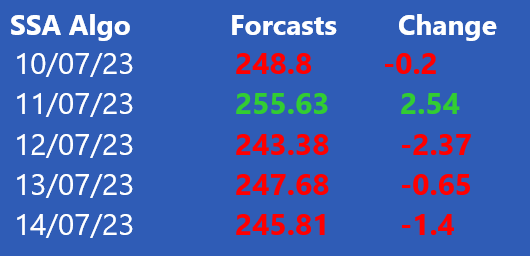
5 days Close Price Forecast
Our goal is to forecast optimal placement for stop-loss orders, helping to manage risk and protect capital in volatile market conditions.
To achieve this, we apply time series forecasting using Single Spectrum Analysis (SSA) on the Rate of Change (ROC)—a momentum metric that measures the relative difference between the forecast day’s closing price and the closing price n days earlier.
By analyzing ROC patterns over time, the model can anticipate potential price movements and suggest data-driven stop-loss levels tailored to current market behavior.
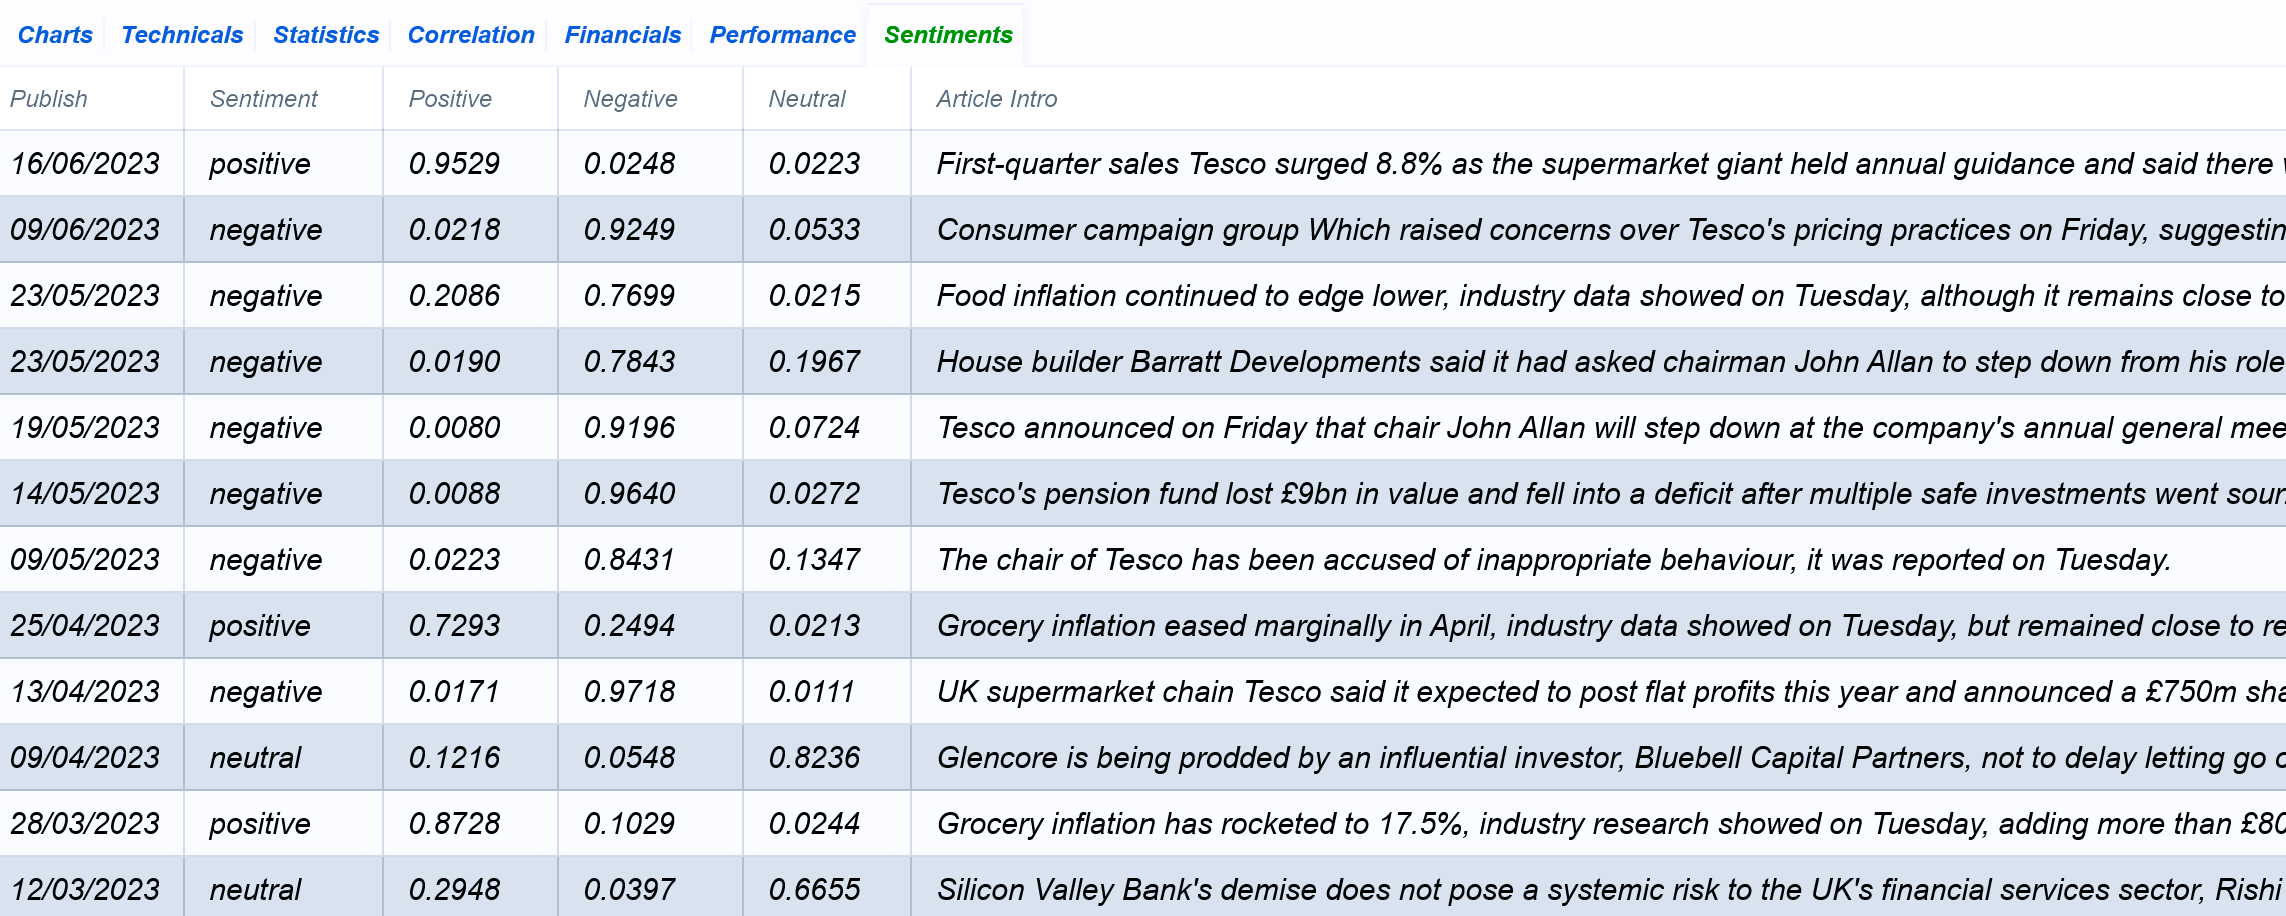
The Sentiment Modelling
Sentiment Analysis is the process of examining text to determine its emotional tone—classifying it as positive, negative, or neutral. In our case, this technique is applied to headlines and regulatory news to assess both the sentiment and the deeper context embedded within financial source materials.
To extract meaningful features from news headlines, we employ natural language processing (NLP) tailored to the financial domain. For this task, we leverage FinBERT—a transformer-based language model pretrained entirely on financial articles.
FinBERT is based on BERT (Bidirectional Encoder Representations from Transformers), a deep neural network architecture developed by Google in 2018. It is further fine-tuned using labeled data from the Financial Phrase Bank by Malo et al. (2014), which maps financial text snippets to sentiment labels. This specialized training enables FinBERT to accurately interpret the sentiment and relevance of financial language.
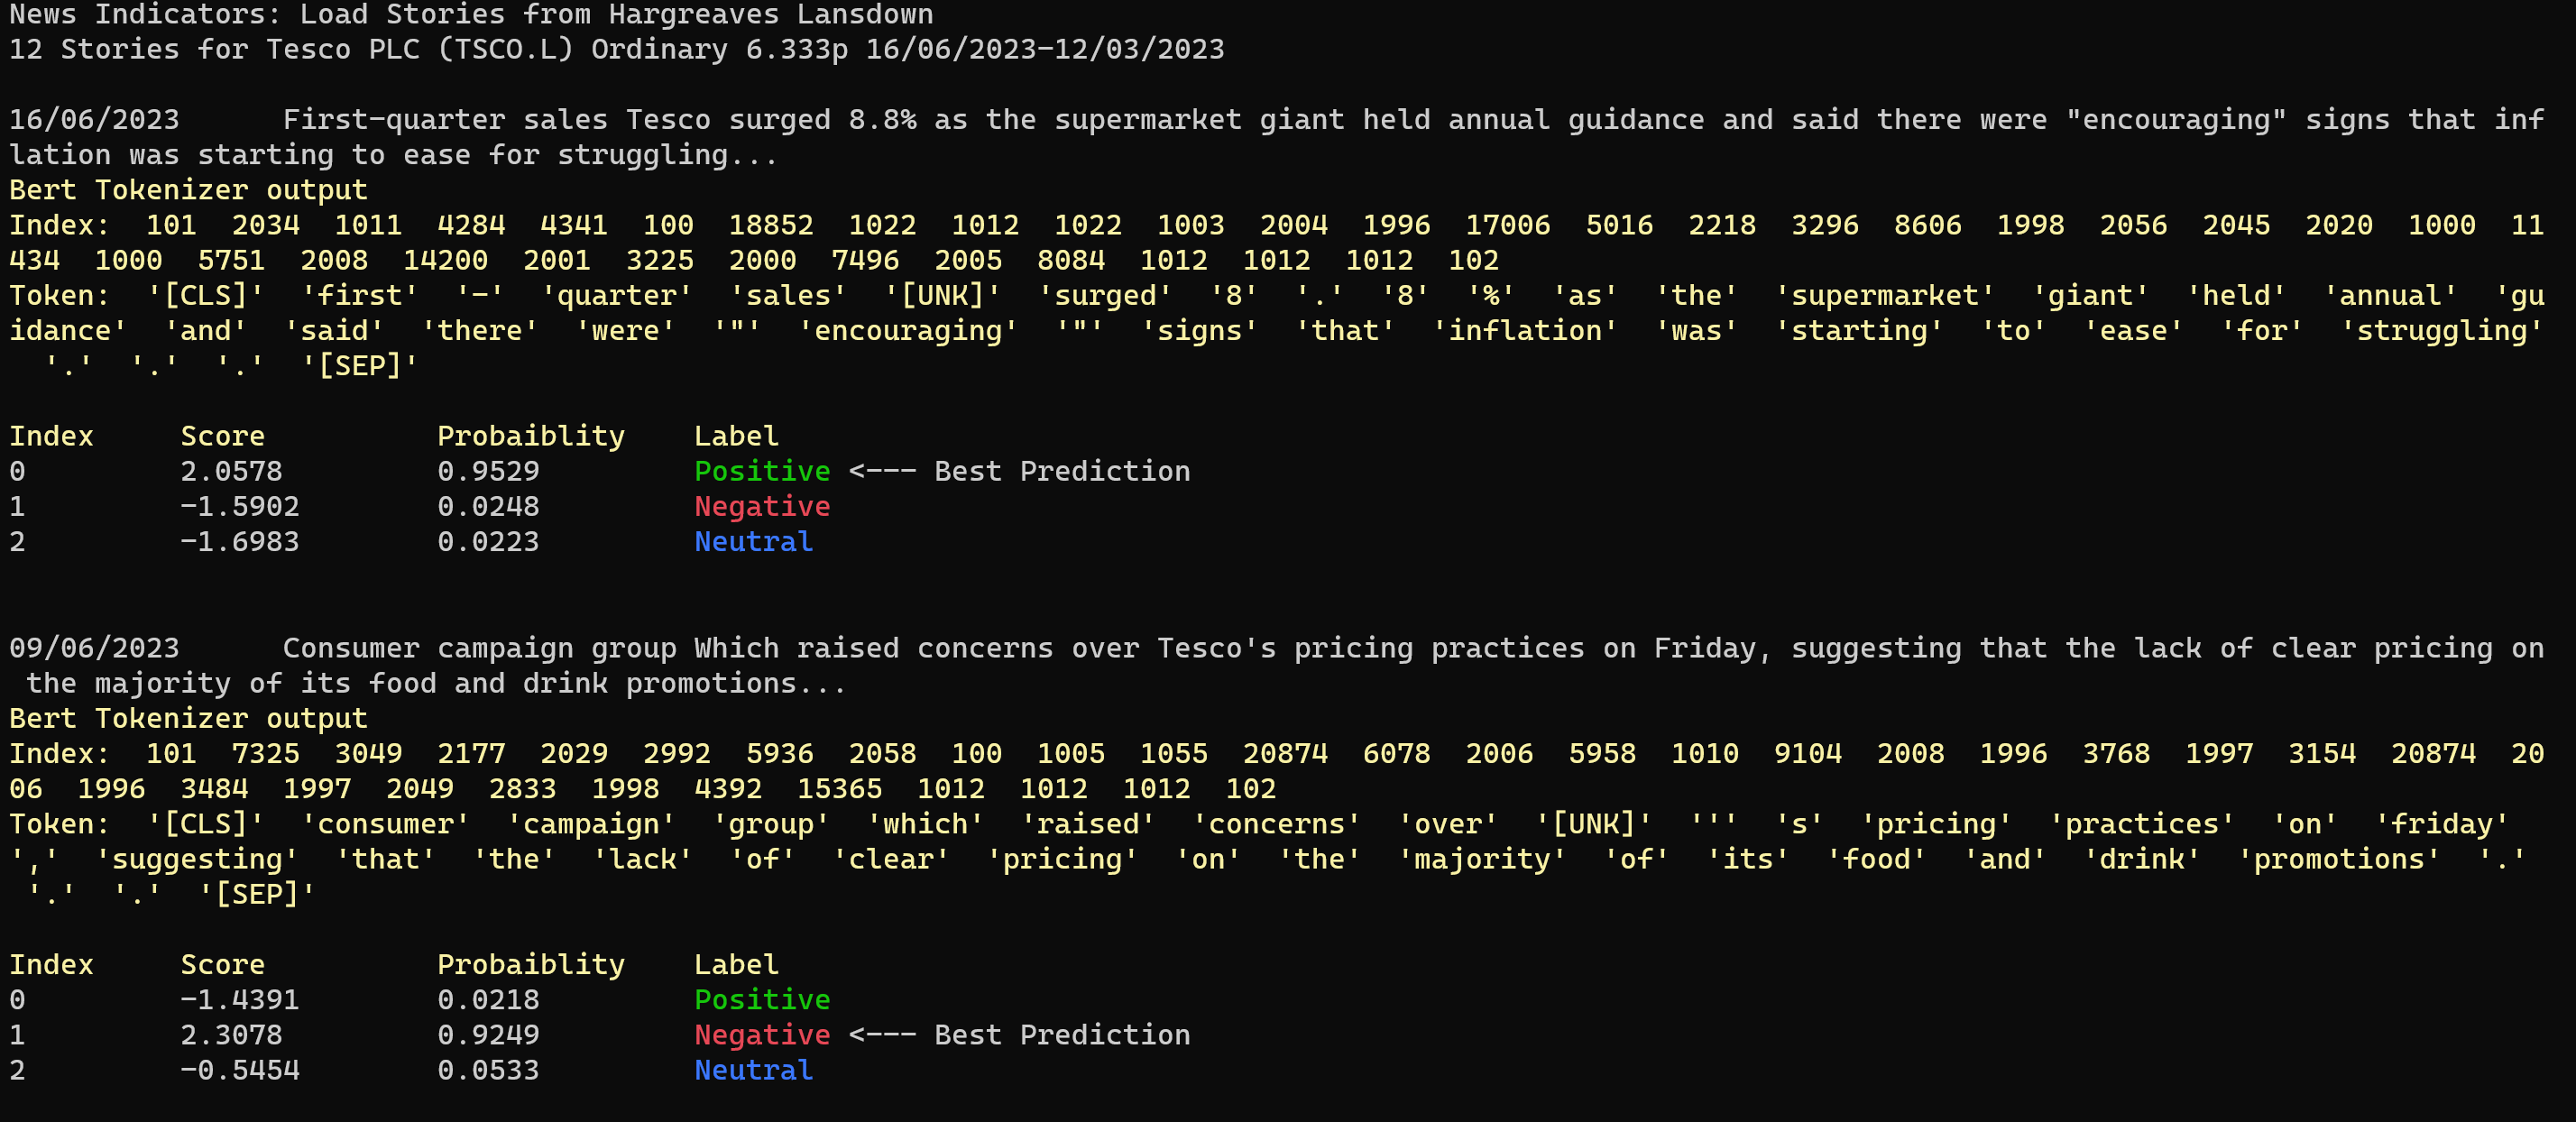
The results below demonstrate that the Deep Learning model is highly accurate.
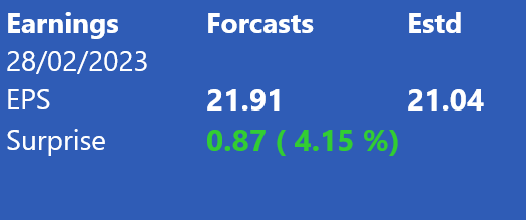
Forecasting Earning Surprises
Many analysts produce earnings estimates for publicly listed companies. The consensus earnings estimate represents the average of these individual forecasts. Share prices can move significantly when there are earnings surprises—such as when actual reported earnings differ markedly from the consensus.
To determine whether a stock should be classified as Buy, Sell, or Hold, we apply Single Spectrum Analysis (SSA) to forecast the likelihood of earnings surprises. Our findings show that past earnings (EPS), current analyst forecasts, and the discrepancies between the two are among the most critical features for predicting future earnings outcomes.
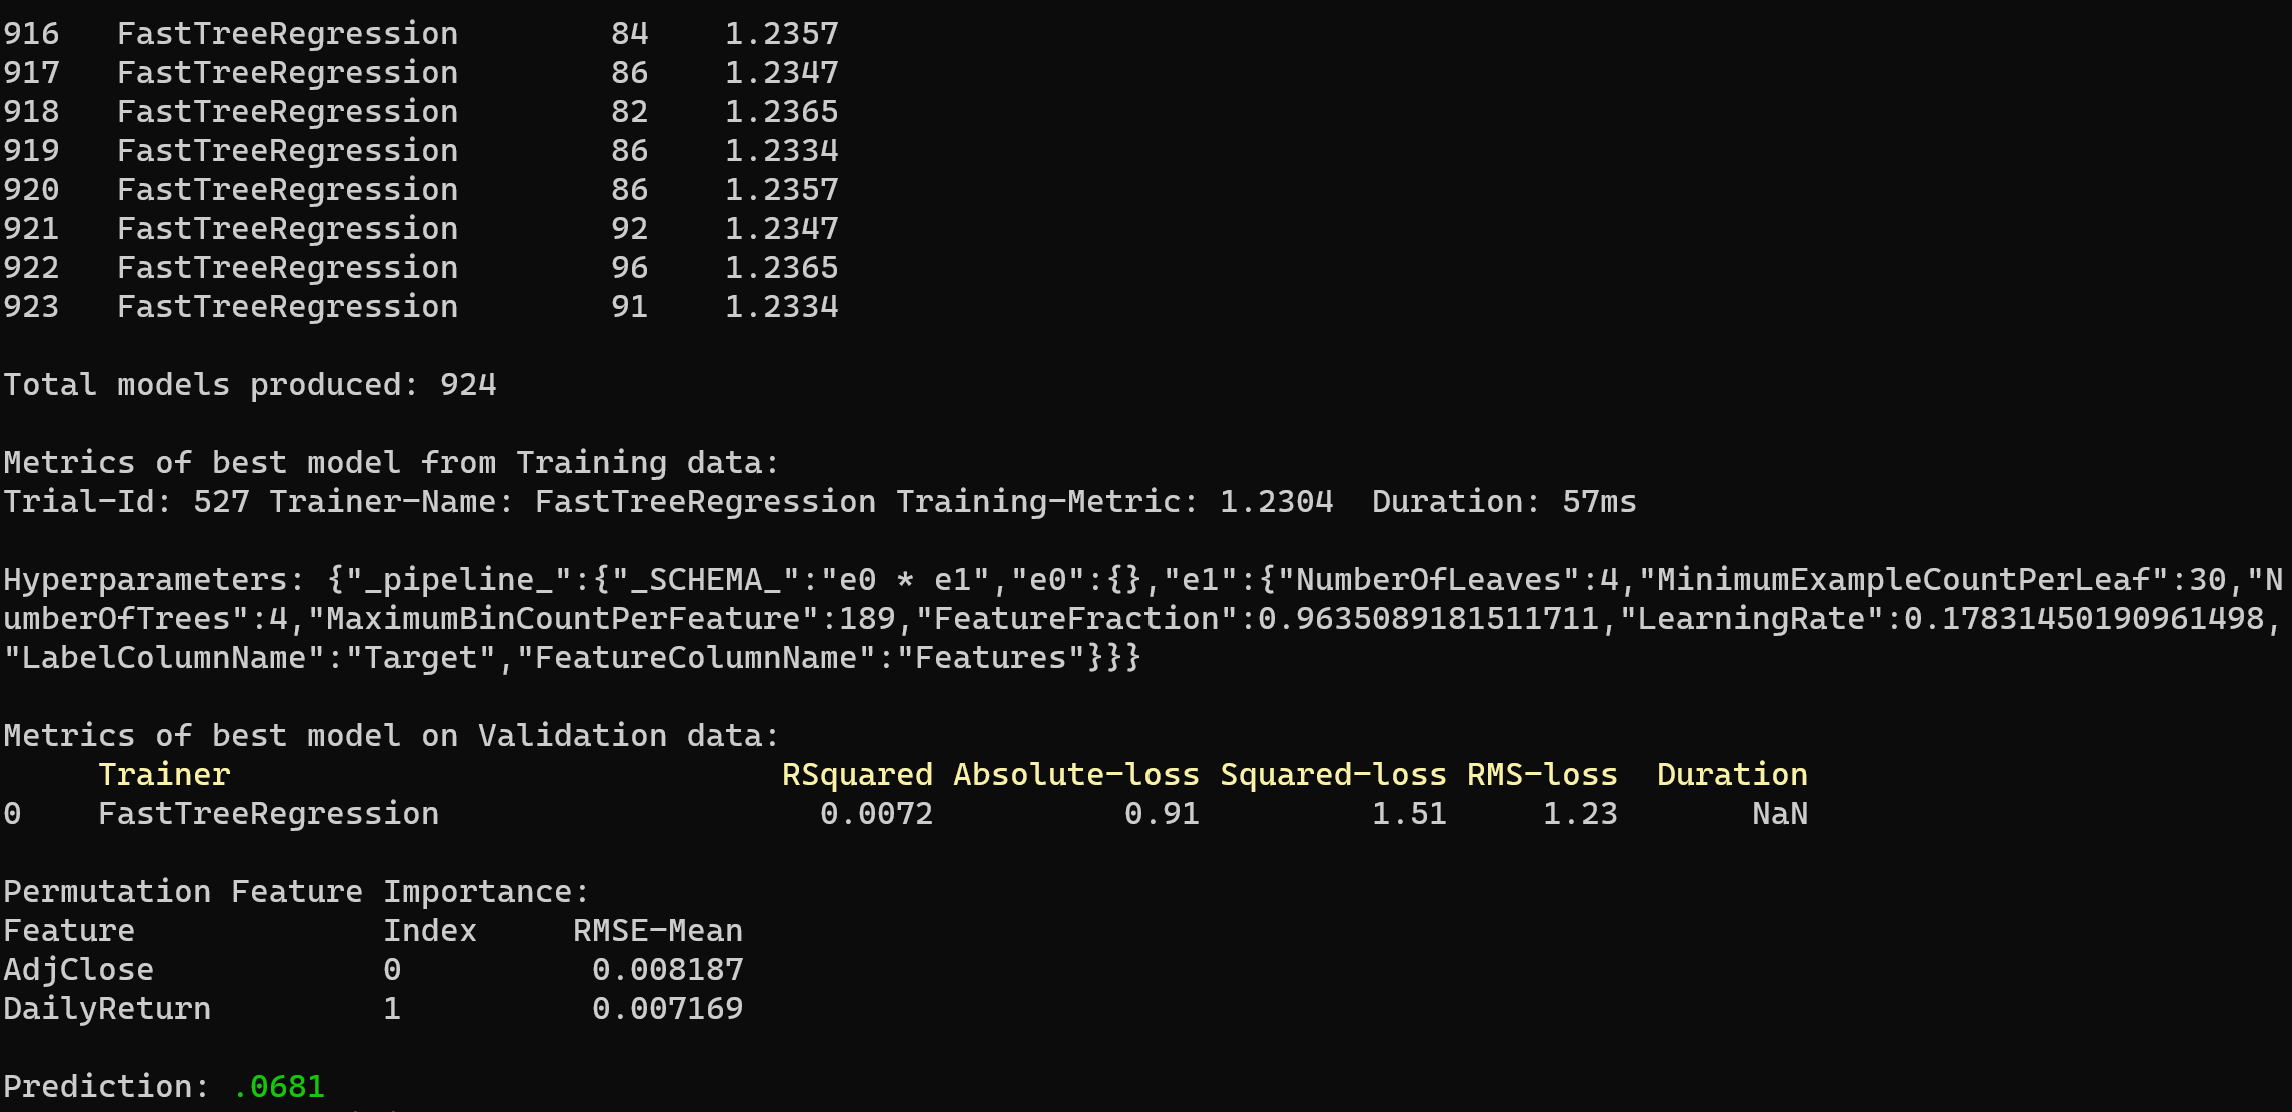
The Model Builder
The ML model builder is a configurable console application that implements our Modelling Methodology. It creates a dedicated factory for each financial instrument and leverages AutoML.Net to build, train, and evaluate the most suitable model for each technical indicator.
Our Modelling Methodology employs a template-based design pattern to streamline and standardize the implementation of various ML tasks.
Accurate feature selection plays a critical role in determining the quality and performance of the machine learning algorithms.
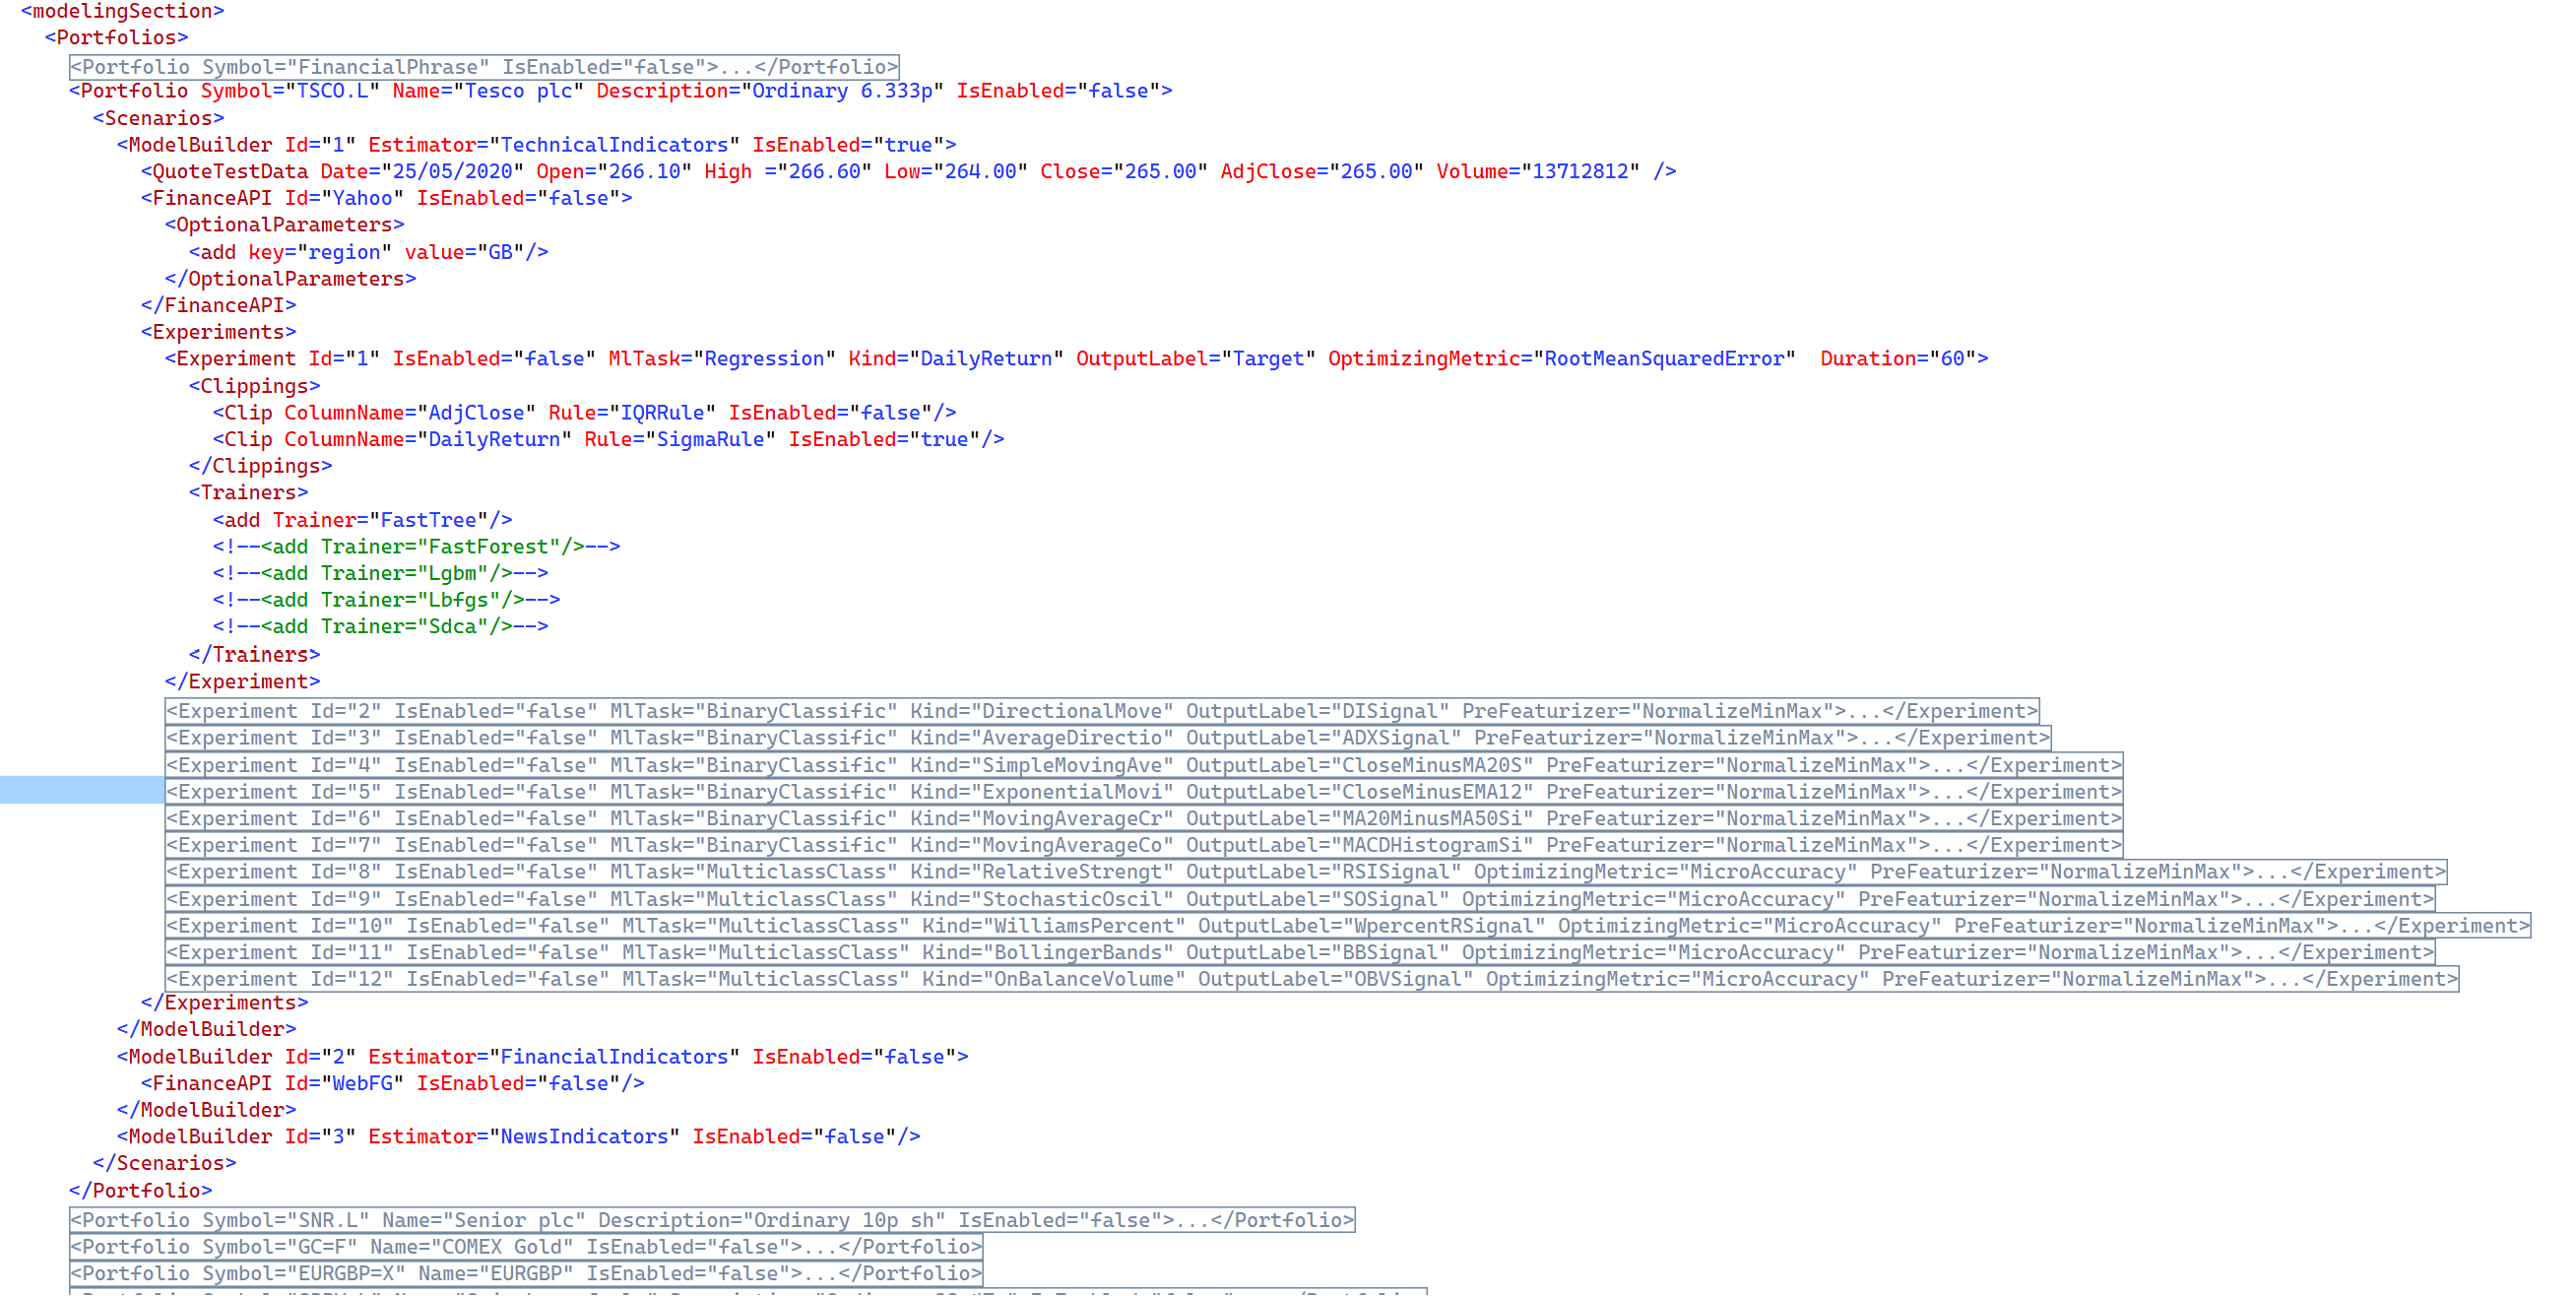
The Model Builder supports the following tools:
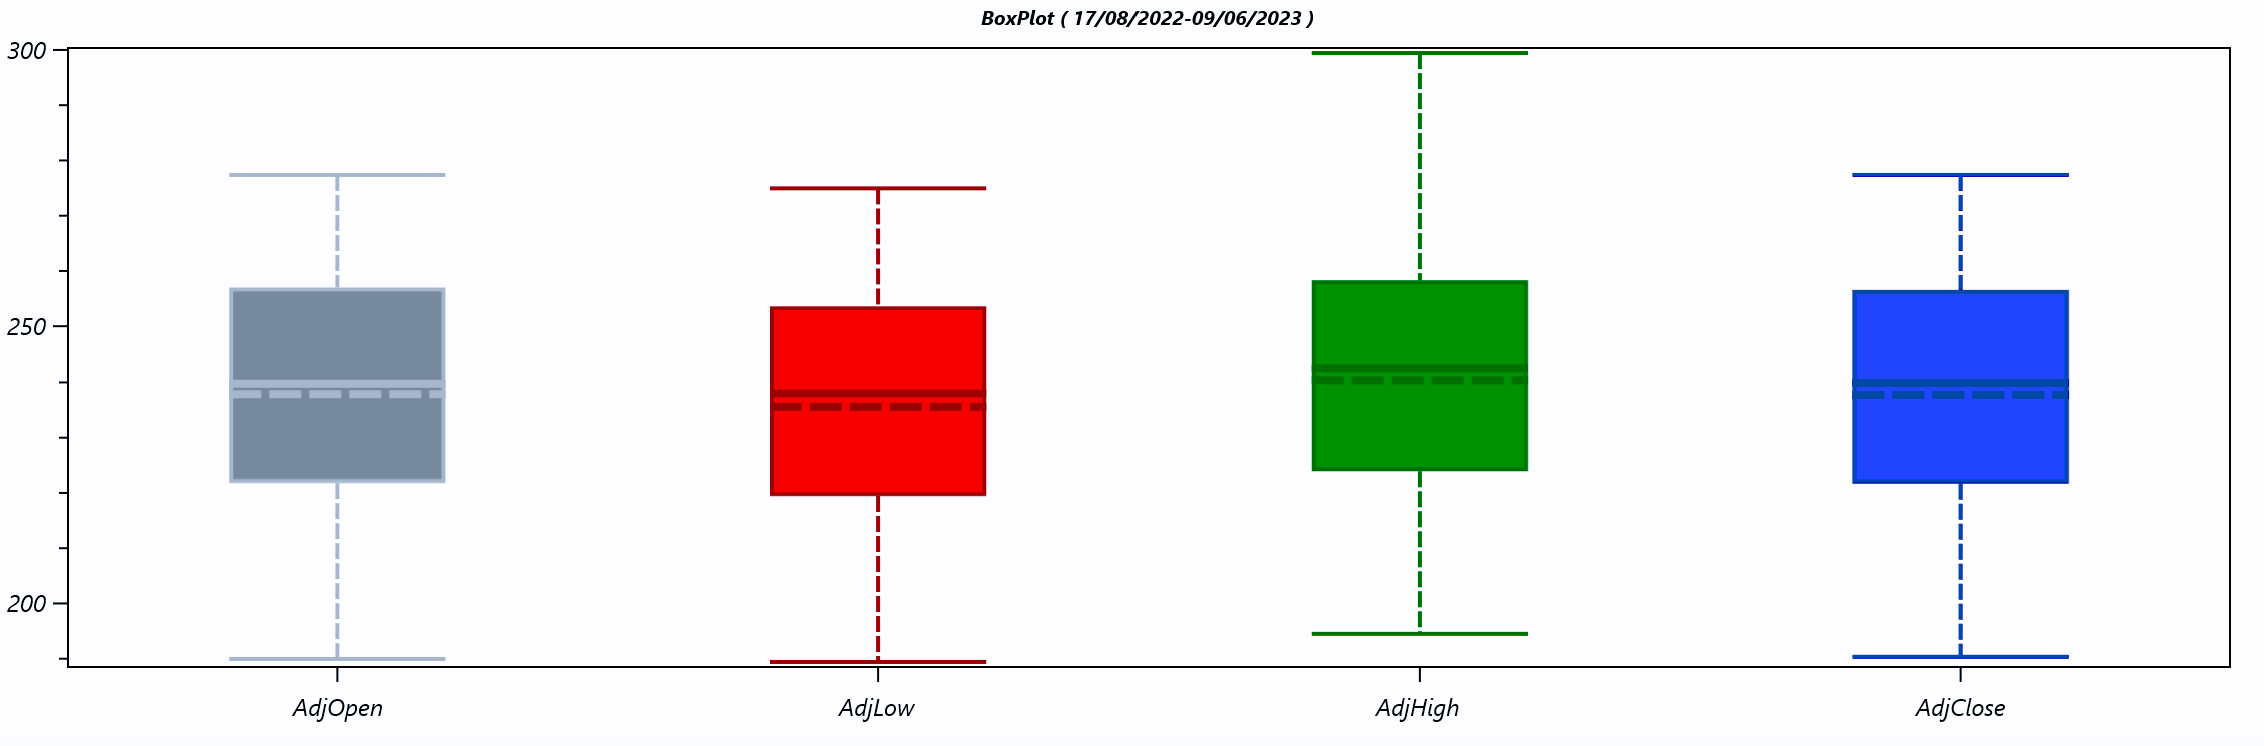
Data Analysis using BoxPlots
Outliers are data points that significantly deviate from the rest of the dataset. Detecting anomalies is a crucial step when preparing data for machine learning models—for example, handling null values due to public holidays or other irregularities in time series data.
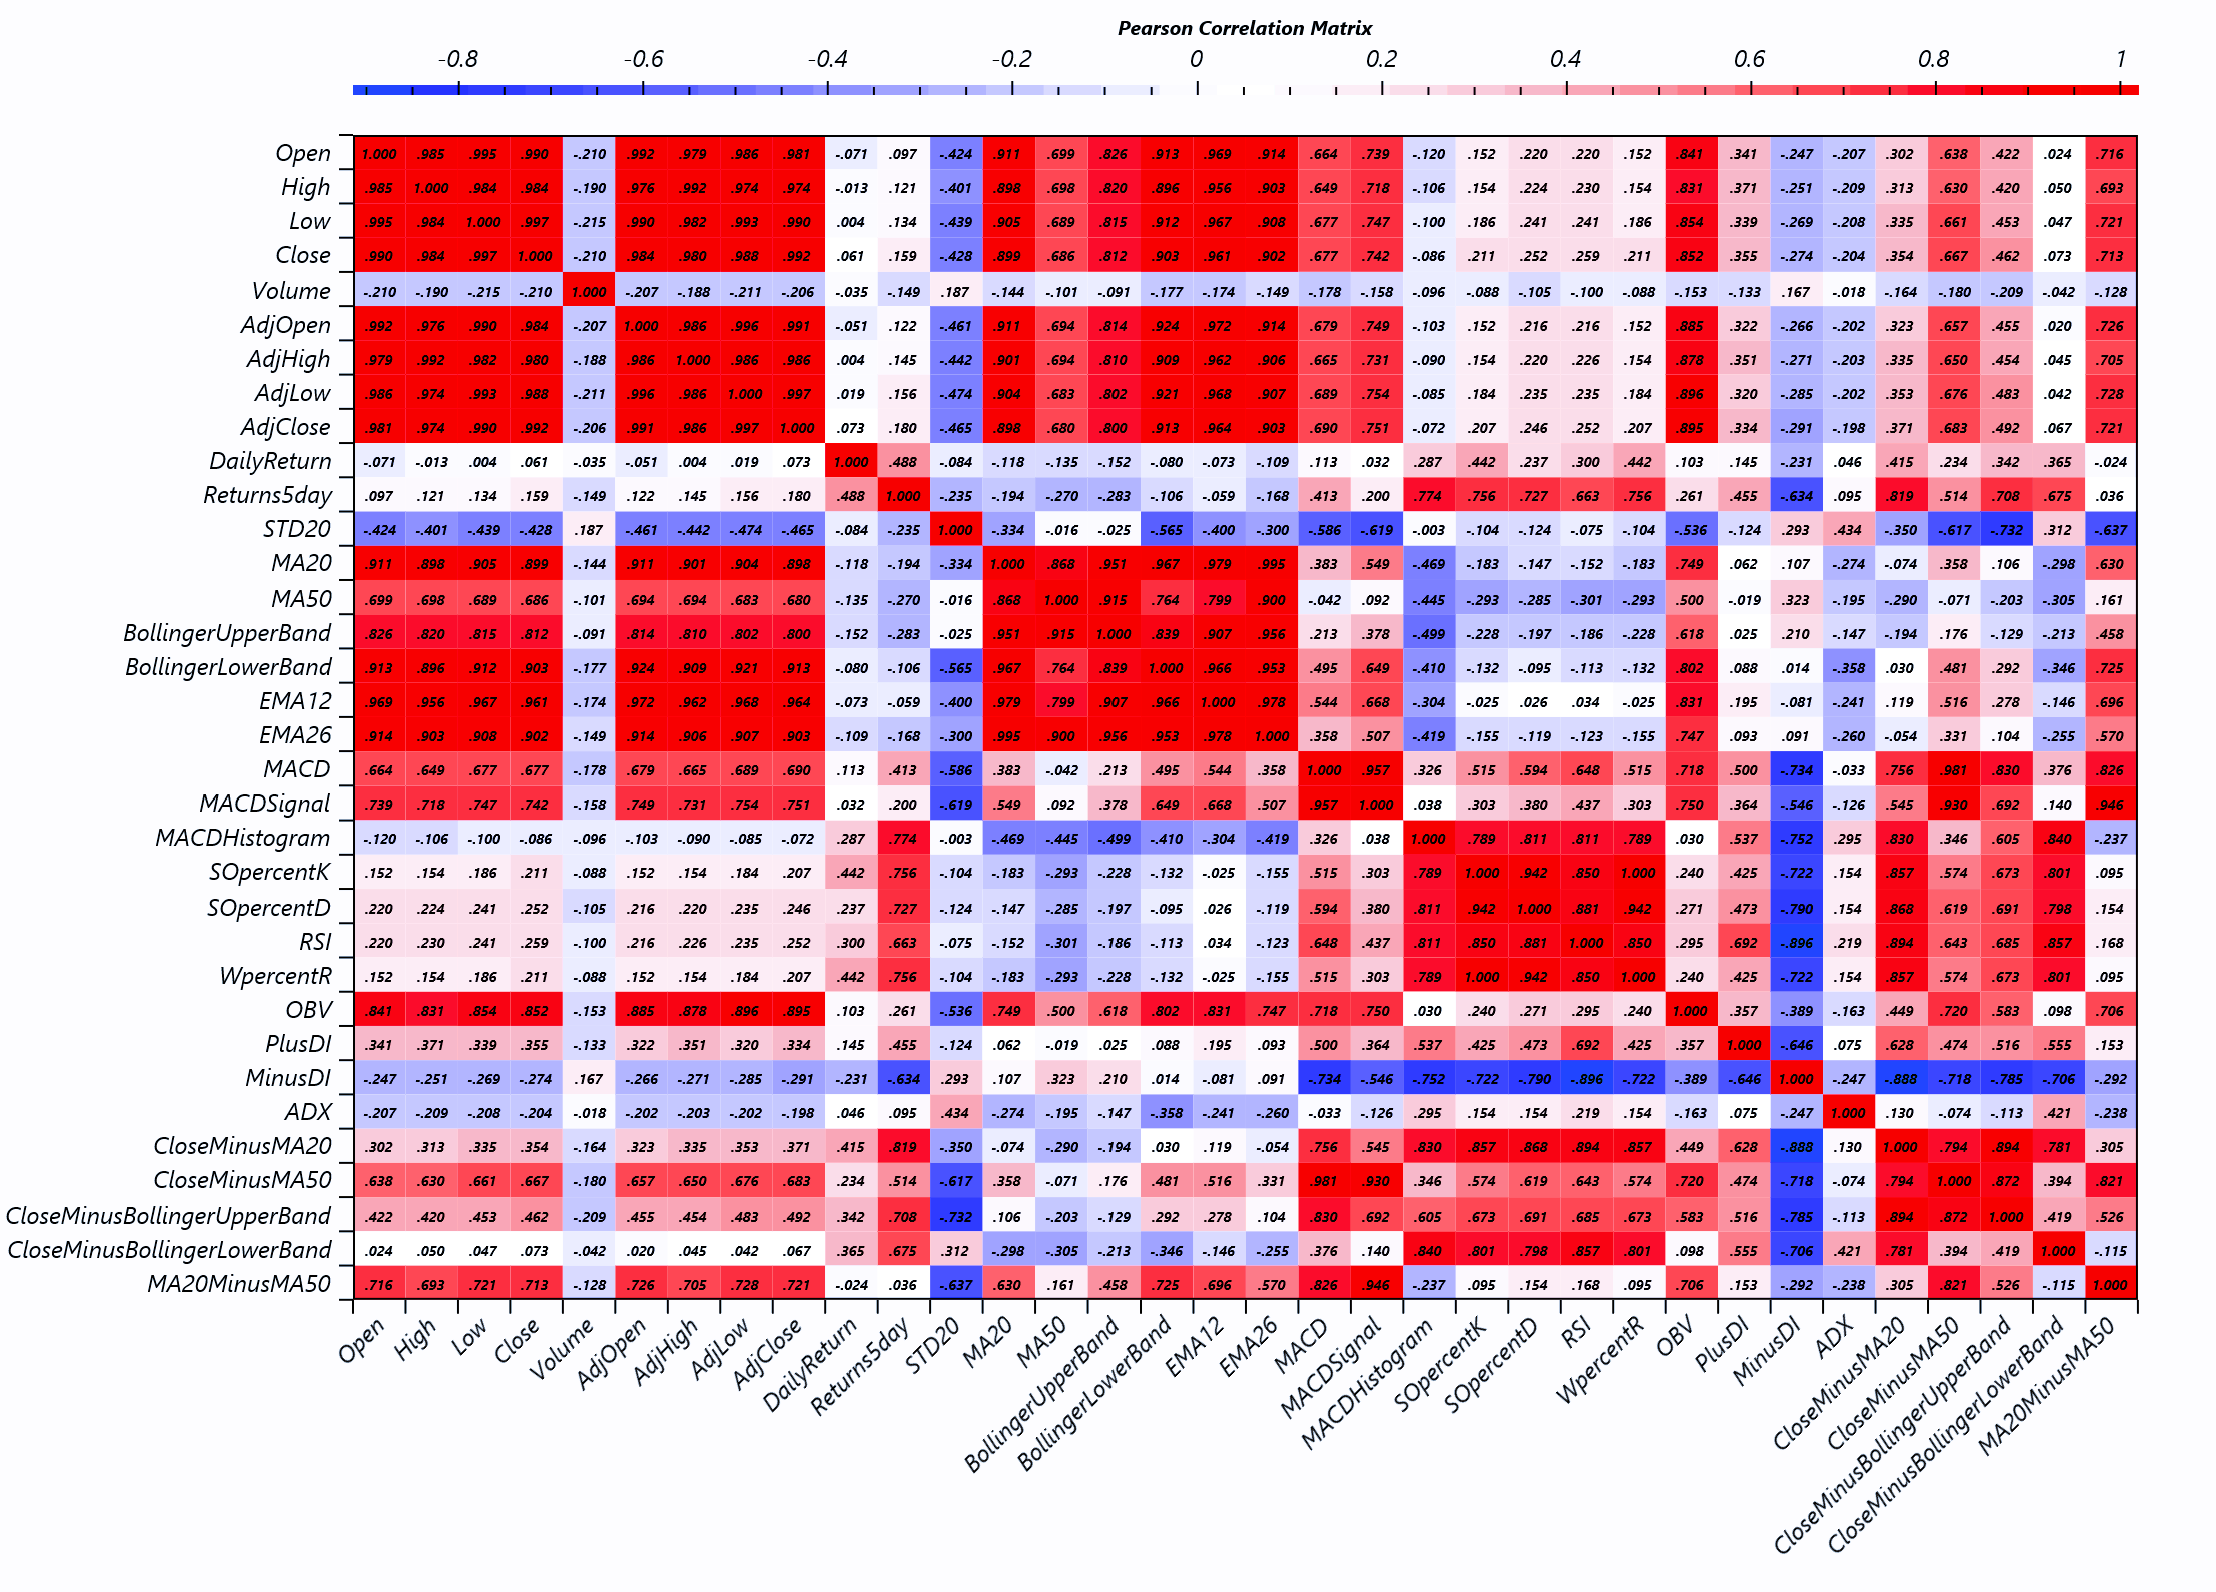
The Pearson Correlation Coefficient
Training datasets can be validated for relationships between variables by calculating the Pearson correlation coefficients, which quantify the linear correlation between pairs of features. This statistical measure helps determine whether—and how strongly—two variables are related, guiding effective feature selection and reducing potential multicollinearity in machine learning models.
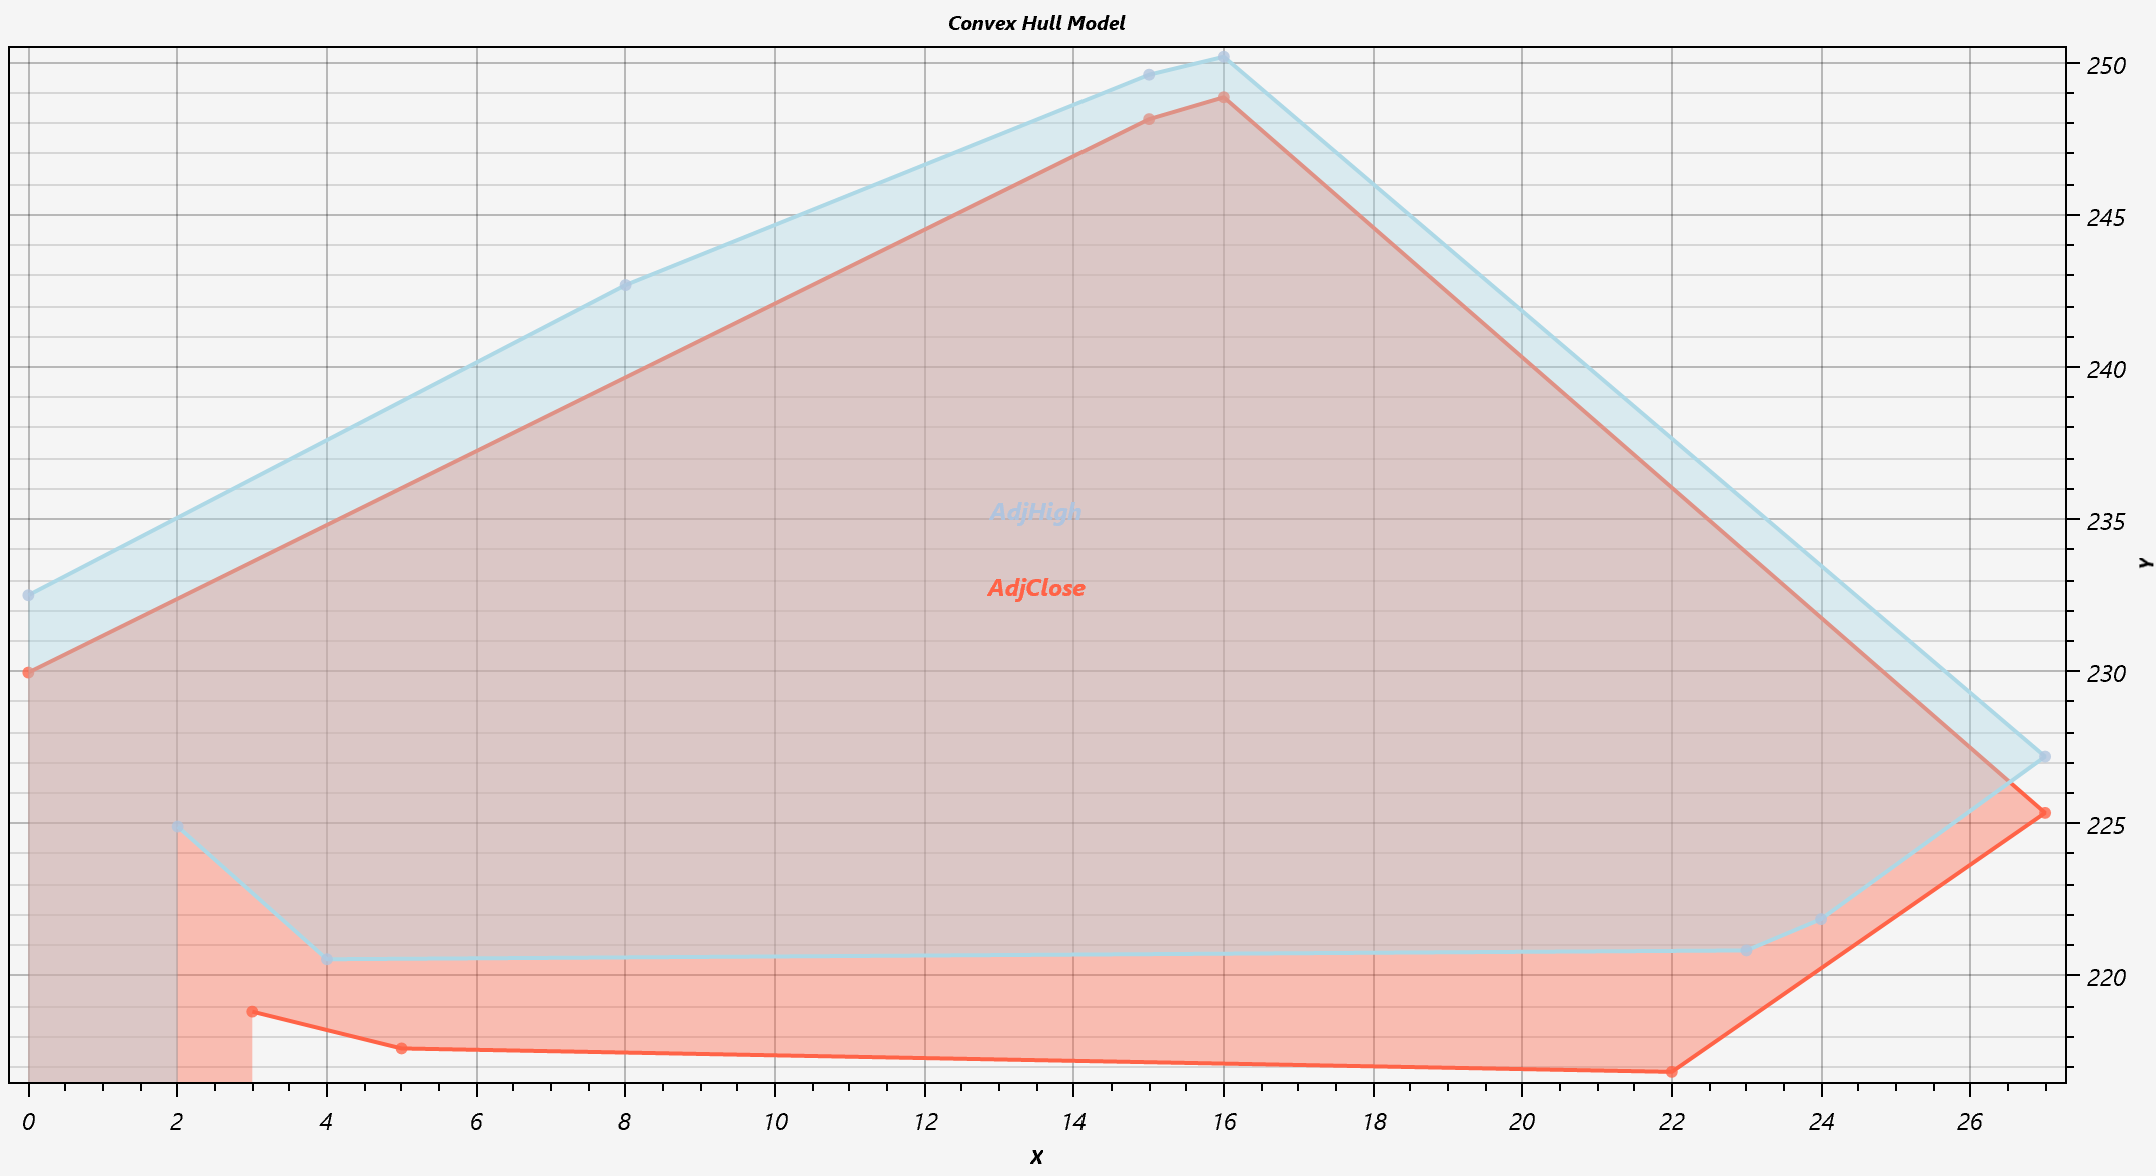
The Linearly Separability test
Certain classification algorithms, such as Support Vector Machines (SVM) and logistic regression, are designed to separate data points by constructing a linear decision boundary (hyperplane) between classes.
To assess whether a dataset is linearly separable, one can analyze the geometry of the data by constructing convex hulls for each class. If the convex hulls do not intersect, it suggests that a linear separation is feasible. Conversely, overlapping hulls may indicate the need for more complex or non-linear classification techniques.